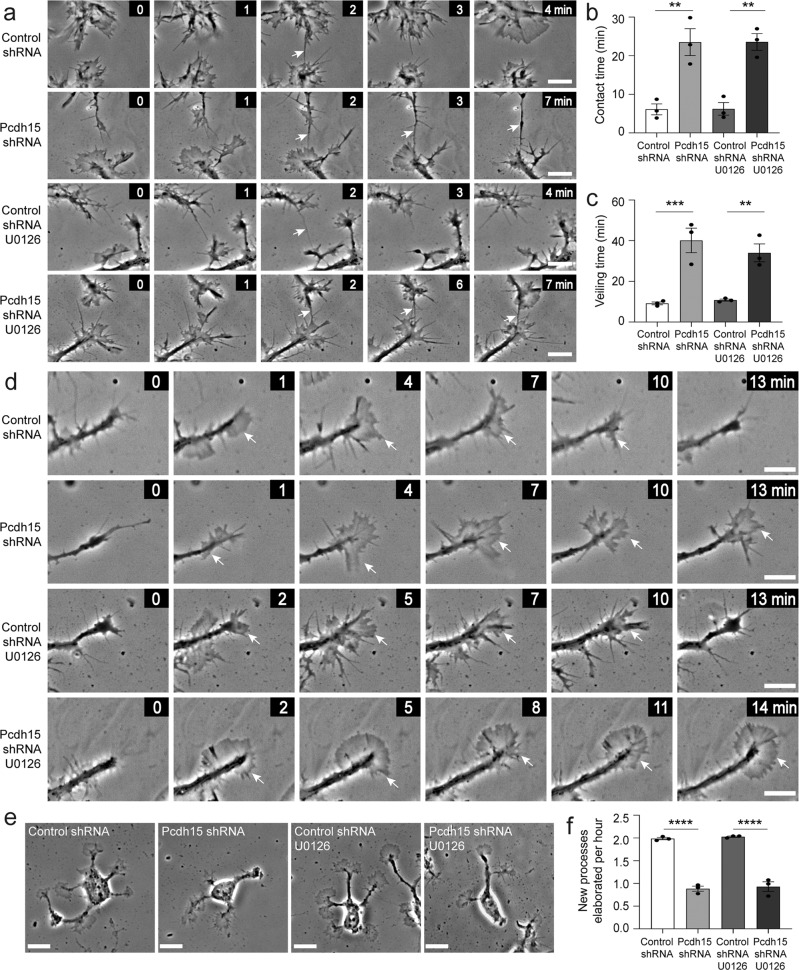
Fig. 6. Pcdh15-mediated inhibition of ERK does not influence filopodial repulsion or veiling kinetics.
a Image series extracted from time-lapse videos showing filopodial contacts (arrows) formed between adjacent OPCs in control- and Pcdh15-shRNA cultures treated with DMSO or U0126 (10 µM). All images are time-stamped relative to the first image in the depicted series (designated as 0 min). b The mean duration (min) that filopodial contacts were sustained once they formed between adjacent OPCs in control- and Pcdh15-shRNA cultures treated with DMSO or U0126 [mean ± SEM, n = 3 independent cultures, ≥44 filopodial contacts measured per condition; two‐way ANOVA: shRNA treatment F (1,8) = 56.29, p < 0.0001; drug treatment F (1,8) = 0.0015, p = 0.96; interaction F (1,8) = 0.00017, p = 0.98 with Bonferroni multiple comparisons test: **p < 0.01]. c Mean OPC process veiling time (min), i.e., the time taken for an OPC process to complete one full extrusion and retraction of its veil in control- or Pcdh15-shRNA cultures treated with DMSO or U0126 [mean ± SEM, n = 3 independent cultures, ≥102 veils analysed per condition; two‐way ANOVA: shRNA treatment F (1,8) = 52.44, p < 0.0001; drug treatment F (1,8) = 0.36, p = 0.56; interaction F (1,8) = 1.05, p = 0.33 with Bonferroni multiple comparisons, **p < 0.01, ***p < 0.001]. d Image series extracted from time-lapse videos showing OPC processes elaborating and retracting veils in control- and Pcdh15-shRNA cultures treated with DMSO or U0126. White arrows indicate extruded veils. All images are time-stamped relative to the first image in the depicted series (designated as 0 min) and images are selected to highlight veil extrusion and retraction. e Images of OPCs 12 h after transfection with control- or Pcdh15-shRNA and treatment with DMSO or U0126 (10 µM). f Quantification of the number of new processes elaborated by OPCs each hour in cultures transfected with control- or Pcdh15-shRNA and treated with DMSO or U0126 [mean ± SEM, n = 3 independent cultures, ≥31 OPCs analysed per condition; two‐way ANOVA: shRNA treatment F (1,8) = 314.7, p < 0.0001; drug treatment F (1,8) = 0.48, p = 0.50; interaction F (1,8) = 0.0007, p = 0.97 with Bonferroni multiple comparisons, ****p < 0.0001]. Image series depicting OPC process generation can be found in Supplementary Fig. 2. Scale bars represent 5 µm (a, d) or 10 µm (e).

