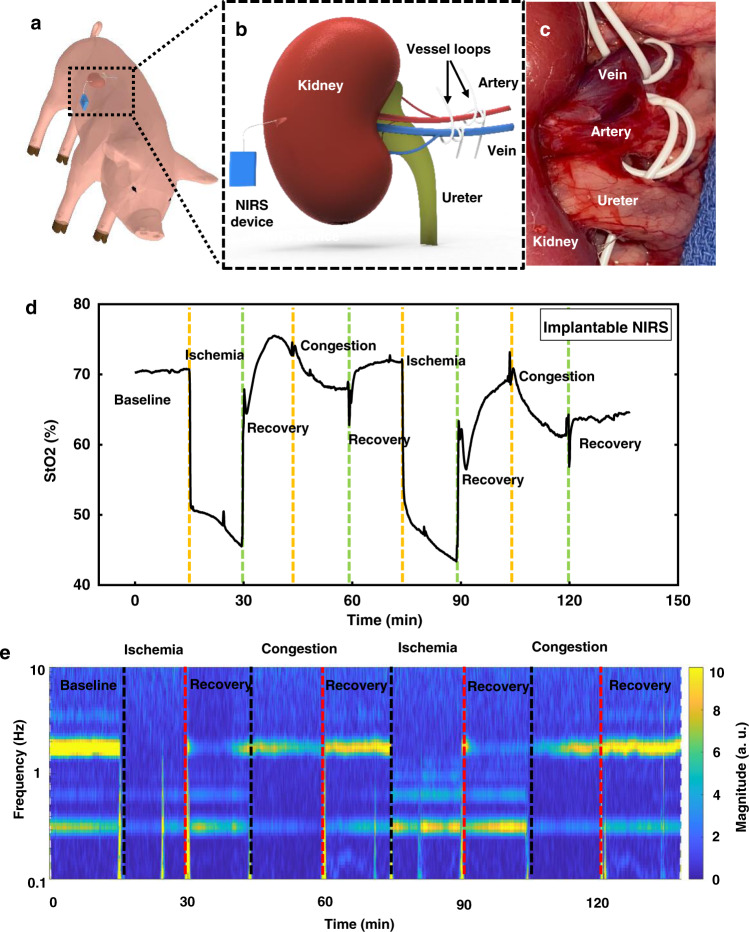
Fig. 5. In vivo measurements in a porcine kidney model.
a, b Schematic illustrations of the implantation strategy of the NIRS probes in the porcine kidney model. c Image of the occlusion of arteries and veins to simulate events of ischemia and congestion, respectively, with vessel loops. d Measured tissue oxygenation saturation using the implantable NIRS probe through multiple experimental cycles of ischemia and congestion. The timeline of respective events (ischemia, congestion, and recovery) shows a consistent match with that of occlusion and release of arteries and veins. e Measured signals plotted as spectrograms to highlight variations of pulsation patterns and respiration patterns. The timelines match well with those of the occlusion and release events, respectively. Source data are provided as a Source Data file.

