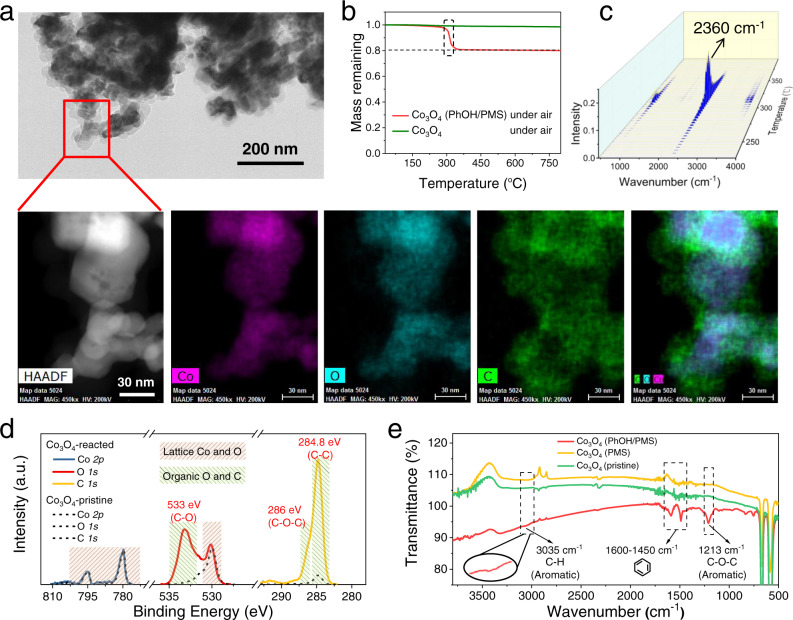
Fig. 2. Product analyses of the model reaction system (Co3O4/PMS/PhOH).
a STEM, HAADF, and EDS elemental mapping images of the Co3O4 after the reaction. b TGA curves of the pristine and reacted Co3O4 in air (O2). The mass loss of 20% for the reacted Co3O4 was equal to the initial concentration ratio of [PhOH] to [PhOH] + [Co3O4], which indicates that the pollutant molecules were fully transferred to the catalyst surface. c 3D-FTIR spectra of the gas products detected from TGA of the reacted Co3O4 in b. The decomposition temperature (centered Around 300 °C) in air (O2) and the gas product (CO2) are characteristic of polymers. d, e XPS spectra (d) and FTIR spectra (e) of the pristine and reacted Co3O4. The signal intensities in the XPS spectra of the pristine and reacted Co3O4 were normalized by that of Co 2p.

