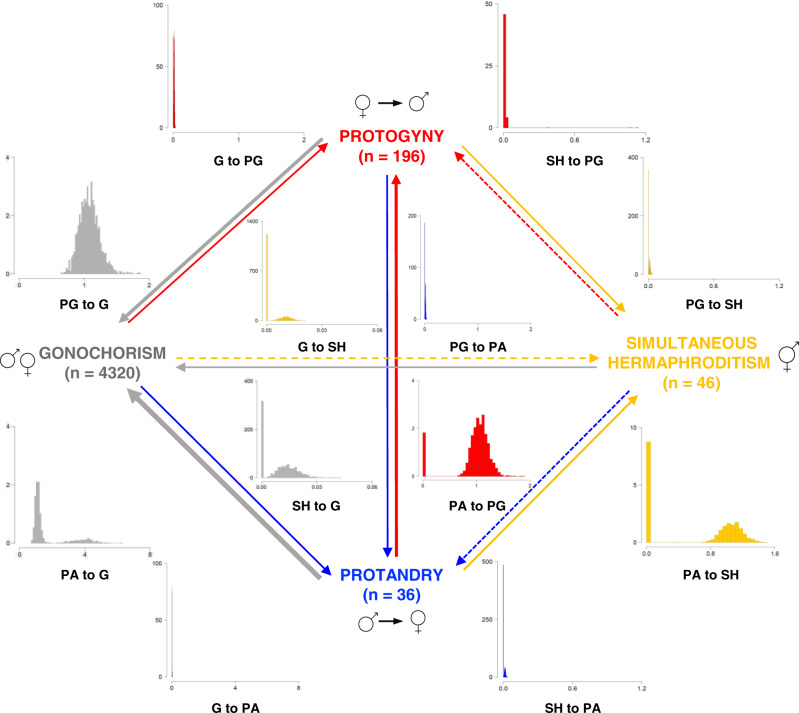
Fig. 4. Transitions rates between sexual systems in teleosts.
Summary of RJ-MCMC Multistate analysis with density plots of the posterior distributions of the transition rates to gonochorism (grey), protogyny (red), protandry (blue), and simultaneous hermaphroditism (yellow). Gonochorism is the estimated likely ancestral condition. Note, only x axis, but not y axis, are the same for each pair of gain and loss between two-character states. The thickness of the arrows is roughly proportional to the mean magnitude of the transition rates from the posterior distribution. Dashed arrows indicate transition rates estimated to be equal to 0 in over 40% of the models in the posterior distributions. Sample sizes of extant species included in our analysis for each sexual system category are indicated between parentheses.

