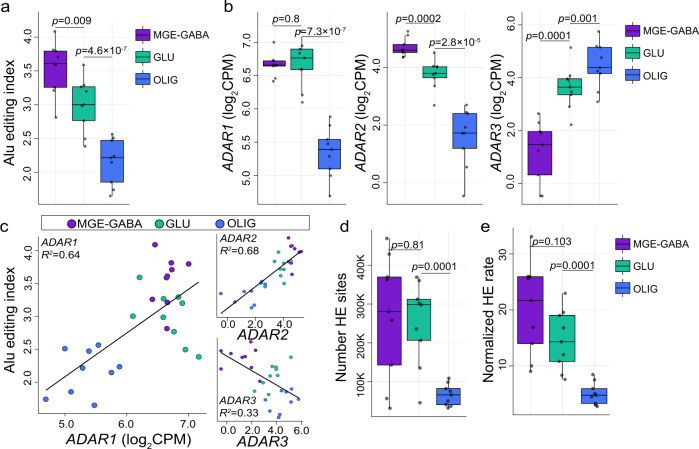
Fig. 1. Global selective editing and hyper-editing in purified cortical cell types.
a The Alu editing index (AEI) (y-axis) and b normalized expression for ADAR1, ADAR2, and ADAR3 (y-axis) measured for each FANS-derived cell population from the human adult prefrontal cortex (PFC, n = 9 biologically independent samples): MGE-GABA, GLU, and OLIG populations. c The amount of AEI variance explained (R2, y-axis) by ADAR expression. d The total number of hyper-editing (HE) sites (y-axis) and e the normalized HE rate (y-axis) across all cell types. All box plots show the medians (horizontal lines), upper and lower quartiles (inner box edges), and 1.5 × the interquartile range (whiskers). The normalized HE rate is defined as the number of HE sites detected per million mapped (MM) bases, computed by dividing the total number of HE sites over the total number of MM bases per sample and multiplying the result by one million. Two-sided linear regression computed significance in mean differences between MGE-GABA vs. GLU and GLU vs. OLIG. No adjustments were made for multiple comparisons. In all panels, MGE-GABA vs. OLIG were deemed statistically significant (p < 0.05). Cohen’s d was used as a measure of effect size pertaining to differences in the AEI and HE signal between cell types.

