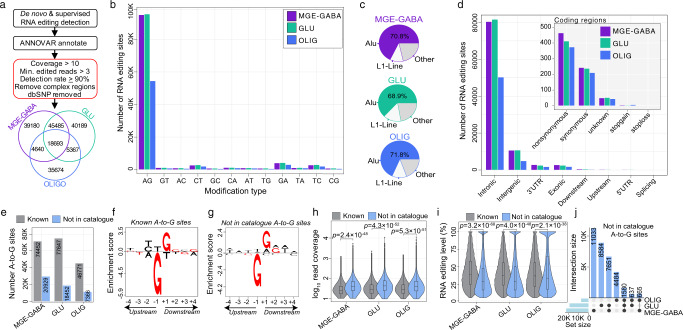
Fig. 2. Identification and annotation of cell-specific RNA editing sites.
a Workflow for detecting high-confidence cell type-associated editing sites combining de novo calling and supervised RNA editing detection. The total number of sites detected per cell type are displayed in the Venn diagram. Data in all panels were derived from the human PFC (n = 9 biologically independent samples). b The total number of RNA editing sites by modification type. c The fraction of sites that map to Alu and L1-line elements relative to all other elements. d The total number of editing sites by genic region. The inset plot shows the breakdown in coding regions. e The number of A-to-G editing sites (y-axis) were grouped based on catalog annotation (known or not in catalog) and independently numerated per cell type. Local sequence motif enrichment analysis for both f known and g not in catalog sites depicting a depletion of guanosine -1bp upstream and enrichment +1 bp downstream of the target adenosine. Known and not in catalog sites for each cell population according to h read coverage (log10, y-axis) and i editing level (%, y-axis). Two-sided Mann–Whitney U-tests computed significance in mean differences in read coverage differences and editing rates between known and not in catalog sites within MGE-GABA, GLU, and OLIG populations and associations with a p value <0.05 were deemed significant. Box plots show the medians (horizontal lines), upper and lower quartiles (inner box edges), and 1.5 × the interquartile range (whiskers). j An upset plot highlights the cell type convergence/divergence of not in catalog A-to-G sites.

