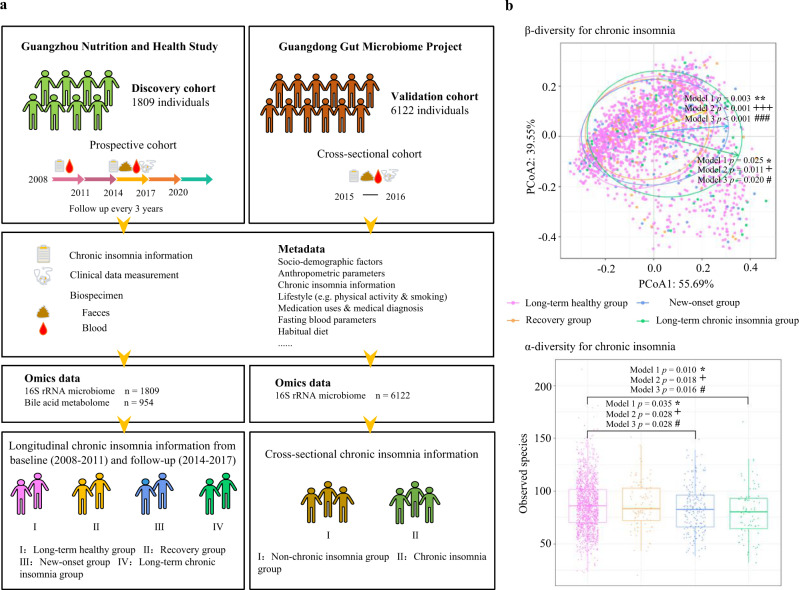
Fig. 1. Study diagram and gut microbiota diversity by chronic insomnia status.
a Conceptual diagram of the present study. b The association of chronic insomnia with α-/β- microbial diversity among the four groups (n = 1809). The association of chronic insomnia with the overall microbial α-diversity parameter Observed species was evaluated using a multivariable linear regression, adjusted for potential confounding factors (three models in the text). Box plots indicate median and interquartile range (IQR). The upper and lower whiskers indicate 1.5 times the IQR from above the upper quartile and below the lower quartile. The results of Shannon index, Chao 1 index, ACE index and Simpson index are reported in Supplementary Fig. 1. β-diversity was evaluated using principal coordinate analysis (PCoA) plot based on Bray-Cutis distance at the genus level. Permutational ANOVA (PERMANOVA) (999 permutations) was used to identify the variation of β-diversity in the human gut microbiota structure comparing the four groups, adjusted for the same covariates. The Benjamini-Hochberg method was used to adjust p values for multiple testing. Value with symbol is significantly different (model 1: *p < 0.05, **p < 0.01, ***p < 0.001; model 2: +p < 0.05, ++p < 0.01, +++p < 0.001; model 3: #p < 0.05, ##p < 0.01, ###p < 0.001). All statistical tests were two-sided. Source data are provided as a Source Data file.

