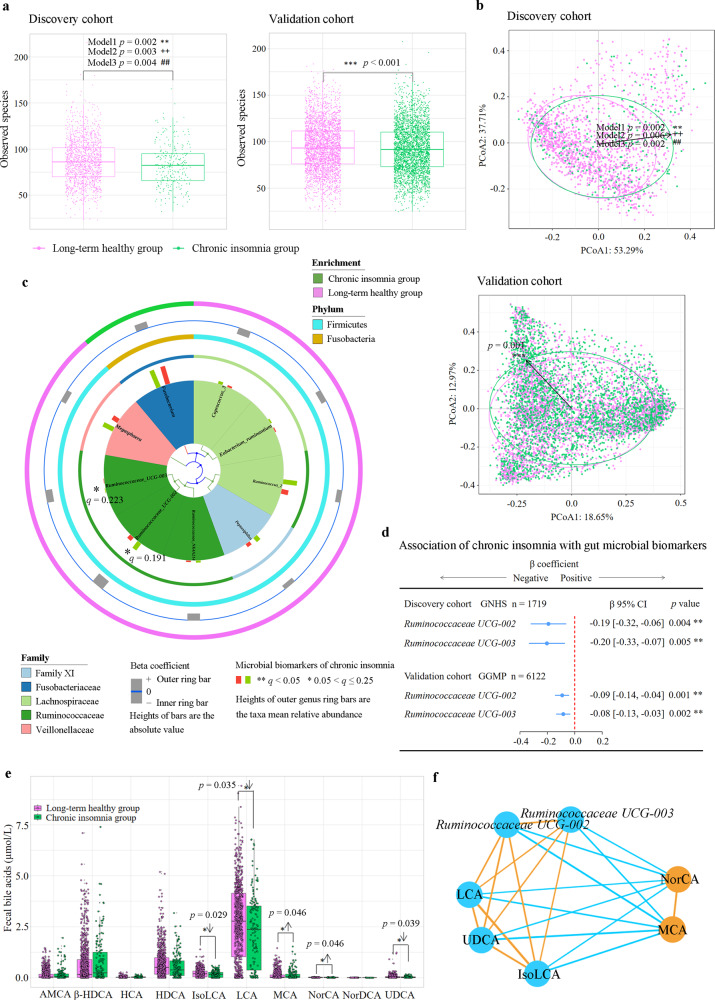
Fig. 2. Association of chronic insomnia with gut microbiota and bile acids.
a Observed species in the discovery cohort (n = 1809) and validation cohort (n = 6122). The results of Shannon index, Chao 1 index, ACE index and Simpson index are reported in Supplementary Fig. 2 (discovery cohort) and Supplementary Fig. 3 (validation cohort). p value was calculated from multivariable-adjusted linear regression with three different models (Methods; model 1: *, model 2: +, model 3: #). Box plots indicate median and interquartile range (IQR). The upper and lower whiskers indicate 1.5 times the IQR from above the upper quartile and below the lower quartile. b β-diversity: principal coordinate analysis (PCoA) of genus-level Bray-Cutis distance in the discovery and validation cohorts. Permutational ANOVA (999 permutations) was used to identify the variation of β-diversity, adjusted for the same covariates as α-diversity. c Multivariate Analysis by Linear Models (MaAsLin) was used to identify the gut microbial biomarkers for chronic insomnia comparing Chronic insomnia group with Long-term healthy group. The q values (false discovery rate adjusted p value) were calculated using the Benjamini-Hochberg method (*q < 0.25, **q < 0.05). d Multivariable linear regression was used to assess the association of chronic insomnia with the gut microbial biomarkers in the discovery and validation cohorts, adjusted for the same covariates as α-diversity. Error bars are beta coefficient with 95% confidence intervals. e, Bile acid biomarkers of chronic insomnia in the GNHS (n = 954). Box plots indicate median and interquartile range. Orthogonal partial least squares discrimination analysis (OPLS-DA) (Supplementary Fig. 5) and multivariable-adjusted linear regression were used to identify potential bile acids associated with chronic insomnia (*p < 0.05, **p < 0.01, ***p < 0.001). f Partial correlation analysis was used to assess the interrelationships between the identified gut microbiota and bile acid biomarkers, adjusted for age, sex and BMI. Orange/sky blue circles indicate chronic insomnia-positive/negative biomarkers. Orange/sky blue lines indicate positive/negative associations. The Benjamini-Hochberg method was used to correct for multiple testing. All statistical tests were two-sided. Source data are provided as a Source Data file. α-MCA α-muricholic acid; β-HDCA β-hyodeoxycholic acid; HDCA hyodeoxycholic acid; HCA hyocholic acid; IsoLCA isolithocholic acid; LCA lithocholic acid; MCA Muro cholic acid; NorCA Nor cholic acid; NorDCA Nor deoxycholic acid; UDCA ursodeoxycholic acid.

