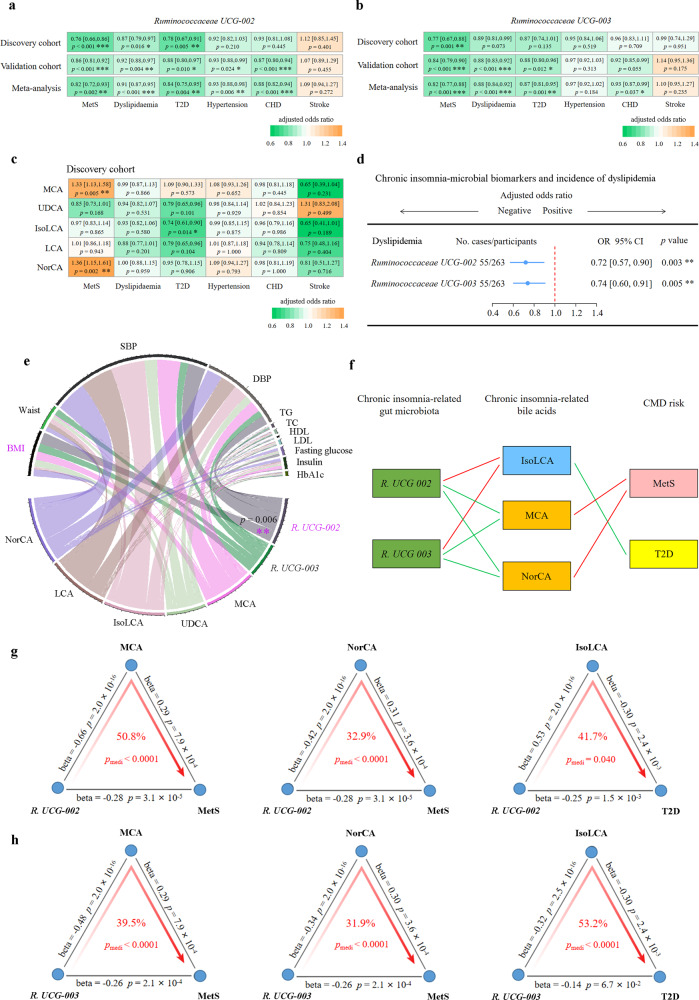
Fig. 3. Association of the chronic insomnia-related gut microbiota-bile acid axis with cardiometabolic diseases.
Multivariable logistic regression was used to estimate the association of the chronic insomnia inverse-related microbial biomarkers Ruminococcaceae UCG-002 (a) and Ruminococcaceae UCG-003 (b) with different CMD in the discovery and validation cohorts, respectively. The effect estimates from the discovery and validation cohorts were pooled using random effects meta-analysis. c Multivariable logistic regression was used to estimate the association of the chronic insomnia-related bile acid biomarkers with CMD in the discovery cohort. d The prospective associations of the above identified gut microbiota biomarkers (measurement of gut microbiota data at the second follow-up) with the incidence of CMD (dyslipidemia) at the third follow-up using multivariable logistic regression, adjusted for potential confounders. Error bars in a–d are odds ratios with 95% confidence intervals. e Associations of the identified gut microbiota and bile acid biomarkers with CMD-related risk factors (BMI, DBP, SBP, waist circumference, fasting serum TG, TC, HDL, LDL, glucose, insulin, and HbA1c) using multivariable linear regression model in the GNHS, adjusted for potential confounders. f Parallel coordinate chart showing the association among gut microbes, bile acid biomarkers and CMD outcomes. The left panel shows the microbial biomarkers, the middle panel shows the bile acid biomarkers, and the right panel shows the CMD outcomes. The red lines across panels indicate the positive association. The green lines across panels indicate the inverse association. g The chronic insomnia inverse-related microbial biomarker Ruminococcaceae UCG-002 affects risk of MetS and T2D though specific bile acid biomarkers, respectively. h The chronic insomnia inverse-related microbial biomarker Ruminococcaceae UCG-003 affects the risk of MetS and T2D through specific bile acid biomarkers, respectively. The gray lines indicate the associations, with corresponding normalized beta values and p values. The red arrowed lines indicate the microbial effects on CMD mediated by specific bile acid biomarkers, with the corresponding mediation p values. p value < 0.05 is considered significantly different. Throughout the above analyses, FDR from multiple testing was controlled by the Benjamini-Hochberg method. All statistical tests were two-sided. Source data are provided as a Source Data file. CMD cardiometabolic disease; T2D type 2 diabetes; MetS metabolic syndrome; SBP systolic blood pressure; DBP diastolic blood pressure; TG triglycerides; TC total cholesterol; HDL high-density lipoprotein cholesterol; LDL low-density lipoprotein cholesterol; HbAlc glycated hemoglobin.

