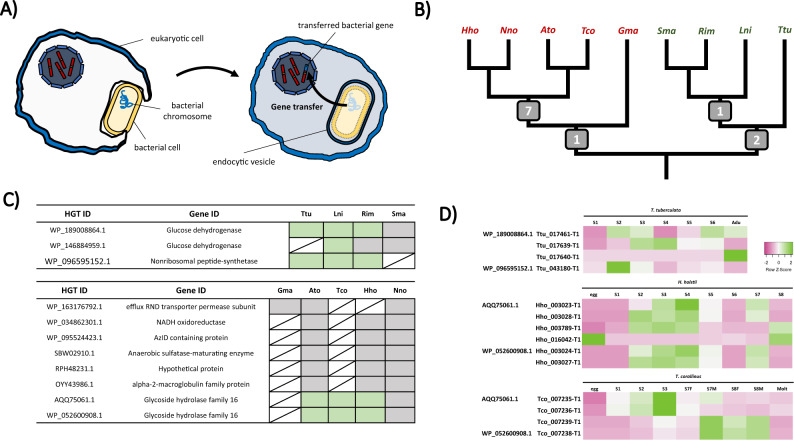
Fig. 5. Horizontal gene transfer (HGT) in myriapods.
A Schematic diagram showing a typical HGT events from prokaryotic cells to eukaryotic cell. B Summary of HGT events identified in different myriapod lineage in this study. The numbers at the nodes indicate the HGT event identified in each lineage common ancestor. C HGT candidates identified and their presence (labelled in green) in each myriapod lineage. D Gene expression of HGT candidates in T. tuberculata, H. holstii and T. corallinus transcriptomes (this study and Qu et al., 2020) The colours indicate the degree of row Z score (green indicates upregulation while pink indicates downregulation).

