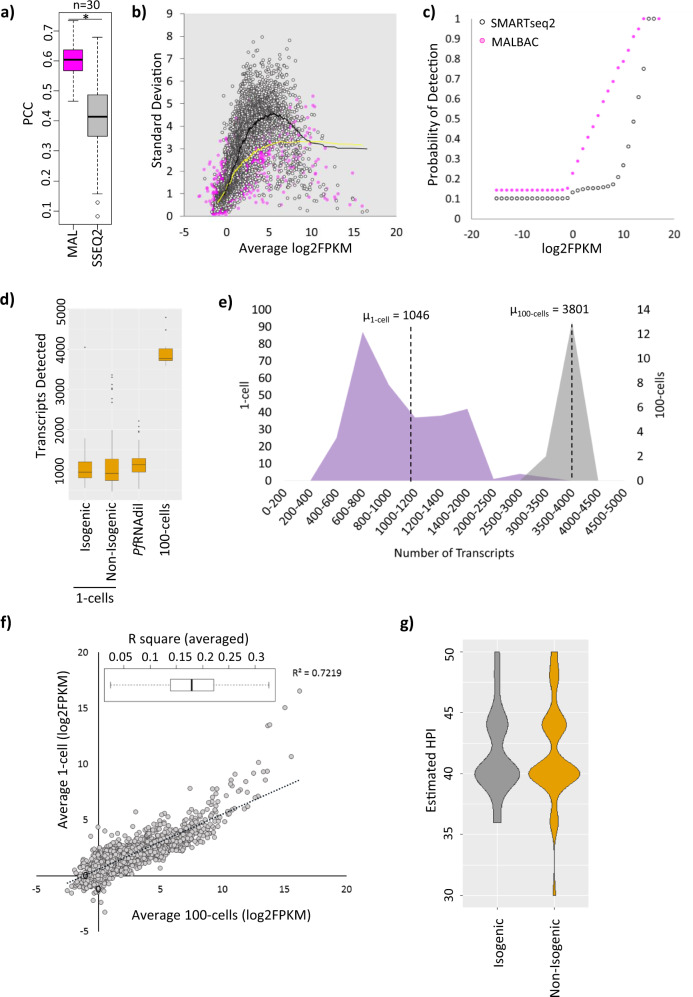
Fig. 1. Highly reproducible MALBAC-based amplification of single cell transcriptomes from P. falciparum schizonts.
a A boxplot showing Pearson correlation coefficients for PfRNAdil (n = 30) amplified by SMARTseq2 (SSEQ2) or MALBAC (MAL). Asterisk denotes significant Wilcoxon rank sum test p-value (p < 2.2e-16). b Scatter plot depicting relationship between standard deviation (SD) and mean transcript expression (log2FPKM) across PfRNAdil replicates (n = 30) for the two techniques. c A scatter plot showing the probability of detection of transcripts (detected in atleast 50% PfRNAdil) across PfRNAdil replicates (n = 30) amplified by MALBAC or SMARTseq2. d A boxplot showing number of transcripts detected in 1-cell (isogenic (n = 97) and non-isogenic (n = 295)), 100-cells (n = 15) and PfRNAdil (n = 49) samples. e A frequency distribution plot of number of transcripts detected in 1-schizonts and 100-schizonts samples. µ denotes the mean number of transcripts expressed in the 1-cell and 100-cells group. f Correlation between averaged 1-cell and 100-cell transcriptomes. The range of averaged R2 values for individual 1-cell and 100-cell transcriptome correlations is shown as a boxplot (inset, median and standard deviation shown, n = 295 for 1-cell, n = 15 for 100-cells). g A violin plot depicting estimated age distribution of non-isogenic and isogenic schizonts. Source data are provided as a Source Data file. All box plots show centre line as median, box limits as upper and lower quartiles, whiskers as minimum to maximum values.

