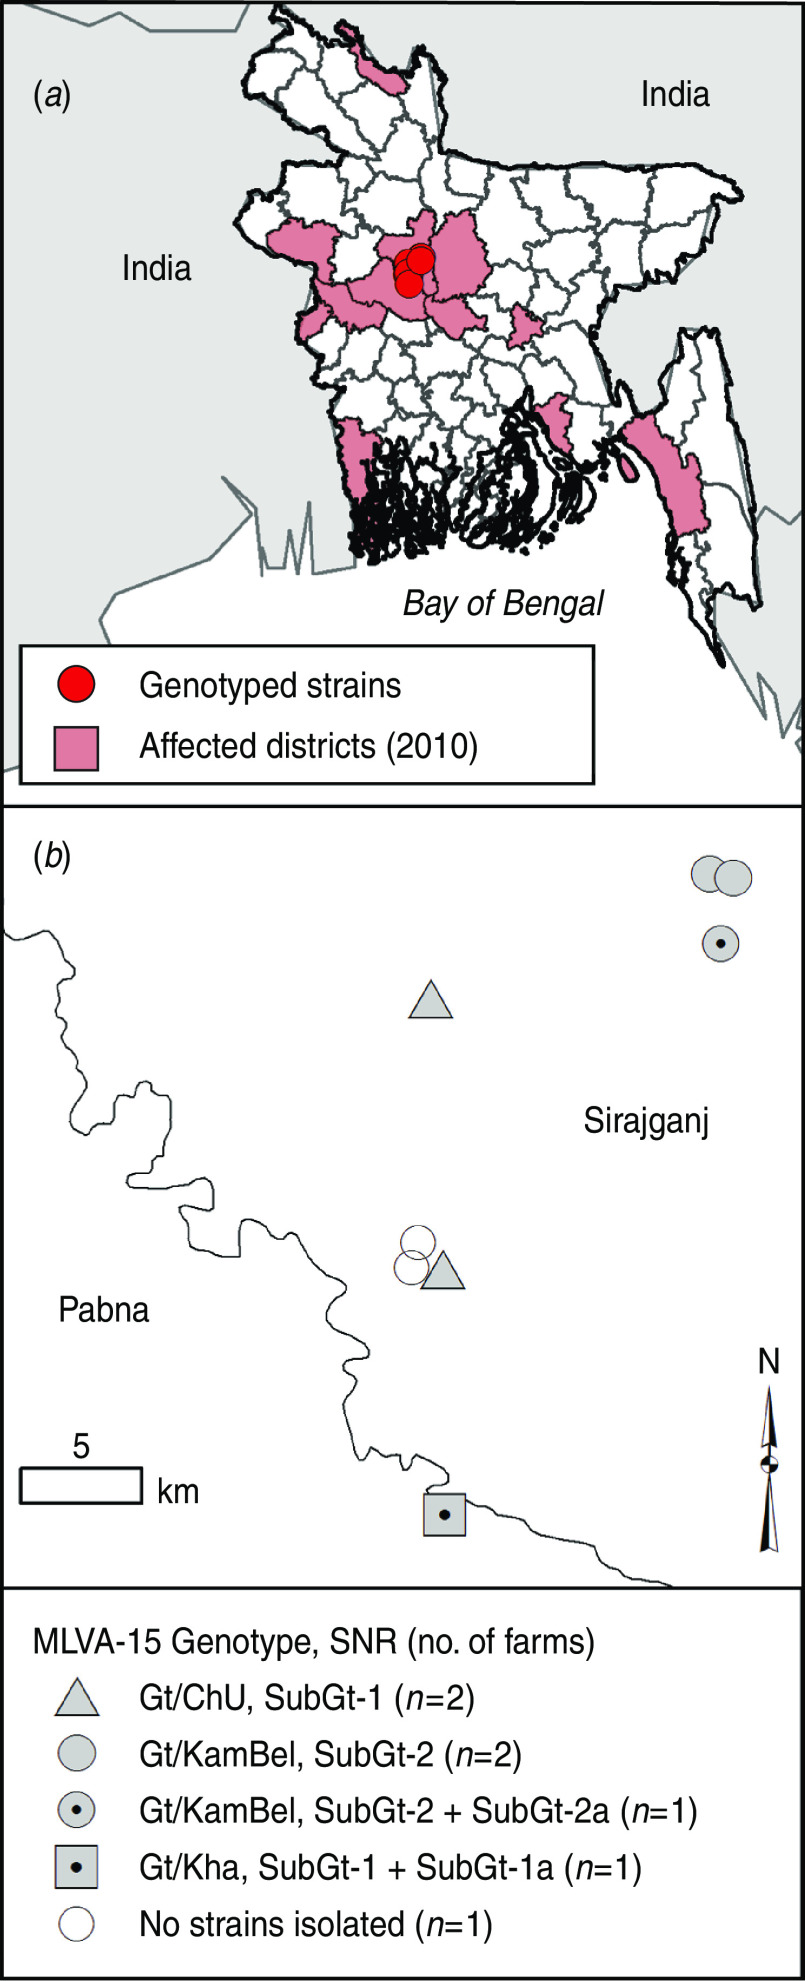
Fig. 1.
(a) The geographical distribution of districts reporting human cases in 2010 ( ) and the location of the eight farms sampled during this investigation (
 ). (b) For the eight farms, grey symbols represent the three MVLA-15 defined genotypes. Grey symbols with black dots represent SNR polymorphisms. Open circles indicate sample locations where no strains were recovered.

