
Fig. 3.
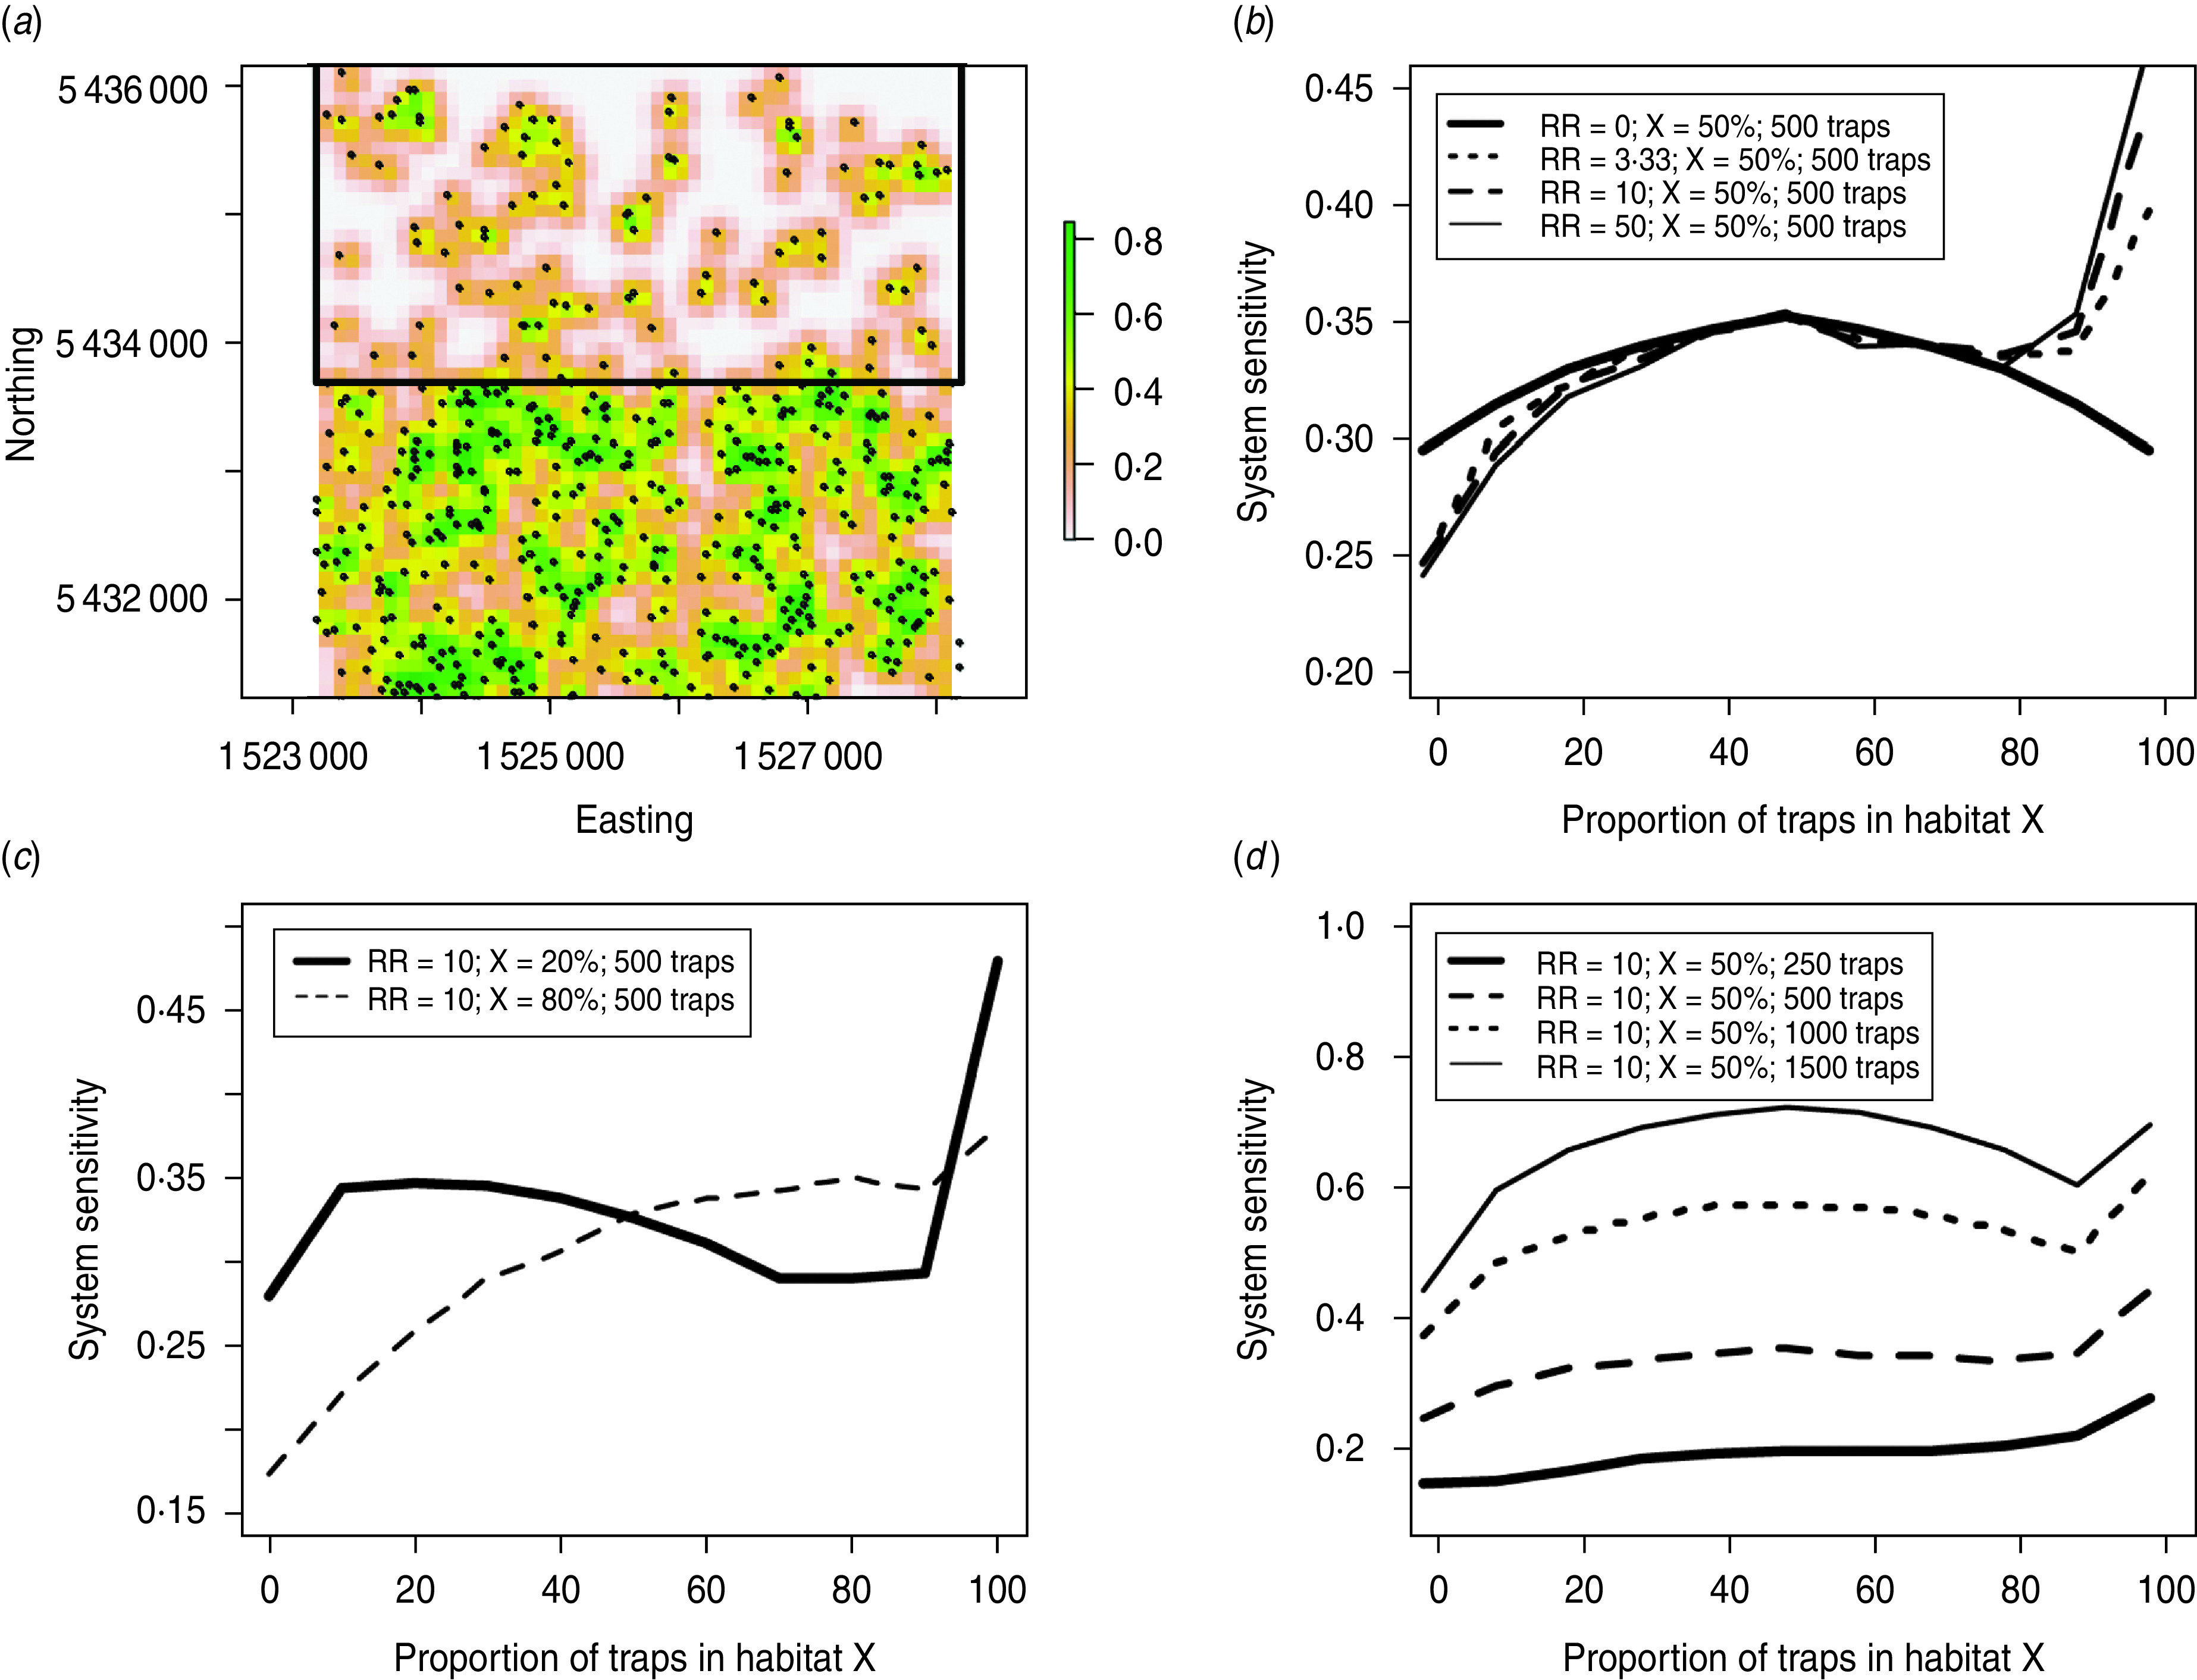
Design and results of sensitivity analysis of varying trap distribution in simulated landscapes with spatial relative risks (RR). This analysis was performed on a square 25-km2 landscape with a grid-cell size of 1 ha, a baseline RR of 1, and a varying RR value in habitat X (a). In the example shown here (a), 20% of the possum traps are in habitat X, which makes up 50% of the landscape. The grid cell-level sensitivities range from >0·8 (green) to 0 (off-white). In this analysis we varied the RR values in habitat X (b), proportion of landscape covered by habitat X (c), and the number of traps deployed (d).