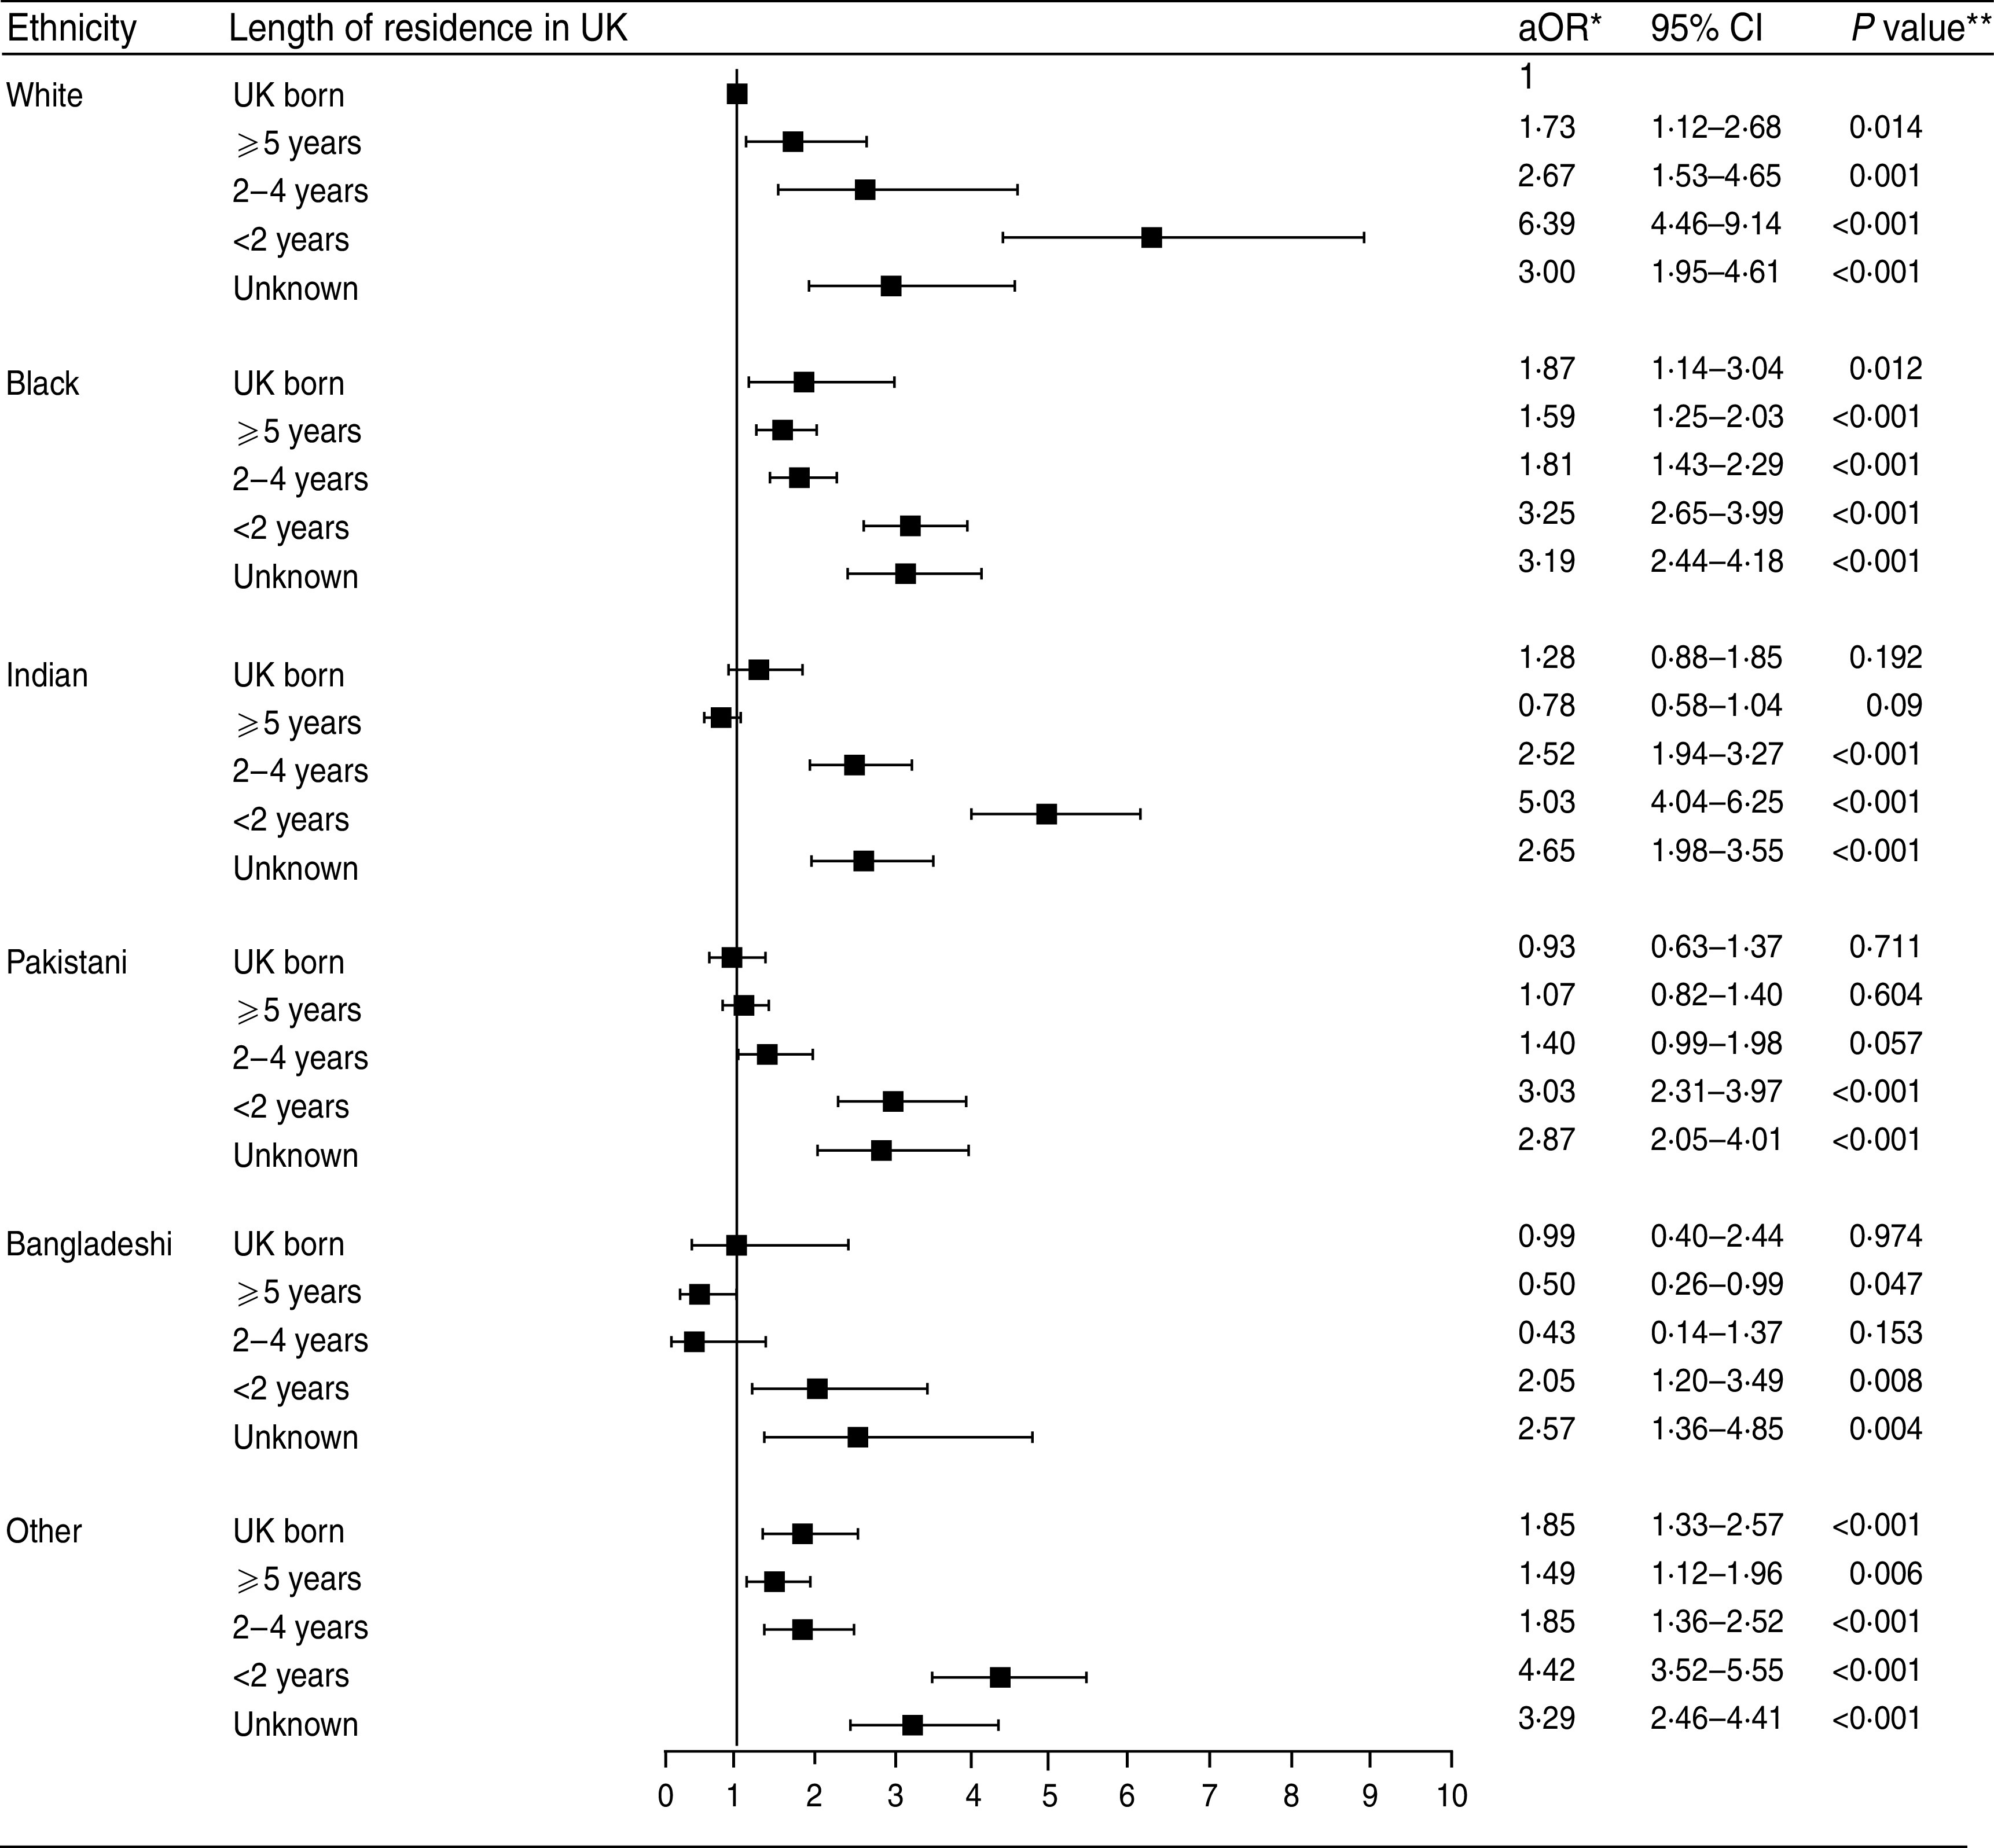
Fig. 2.

Adjusted odds ratios (aOR) and 95% confidence intervals (CI) for the interaction of length of residence and ethnic group on loss to follow-up of tuberculosis cases in England, Wales and Northern Ireland 2001–2007, N=37 537 (excluding cases with data missing for sex, age, ethnic group, place of birth or site of disease). * Adjusted for age, sex, region of reporting, year of notification, site of disease and previous diagnosis; ** Likelihood ratio test.
