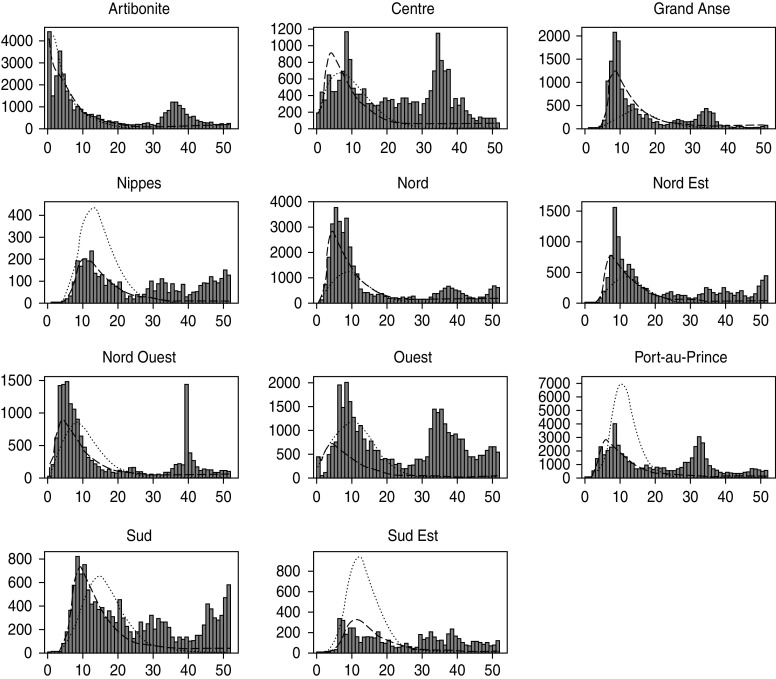
Fig. 4.
Weekly projections of hospitalizations by department for the first spatial-temporal model iteration (6-week model) and the third spatial-temporal model iteration (16-week model) compared to observed hospitalization data for 1 year. Weekly number of hospitalizations are on the y axis, and epidemiological week is on the x axis. ▪, Observed; · · · · · · ·, 6-week model; – – –, 16-week model.

