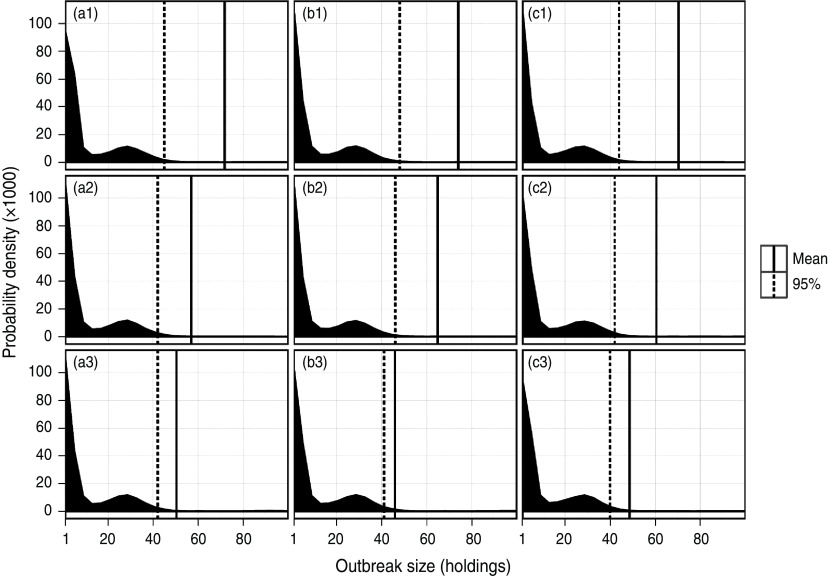
Fig. 1.
Distribution of the total number of infected premises resulting from a simulated incursion of LPNAI in a commercial duck premises in GB, according to the surveillance scenario adopted. Sample sizes of 20, 40 and 60 are represented in columns (a), (b) and (c), and back-tracing windows of 2, 3 and 4 weeks are represented in rows (1), (2) and (3), respectively.

