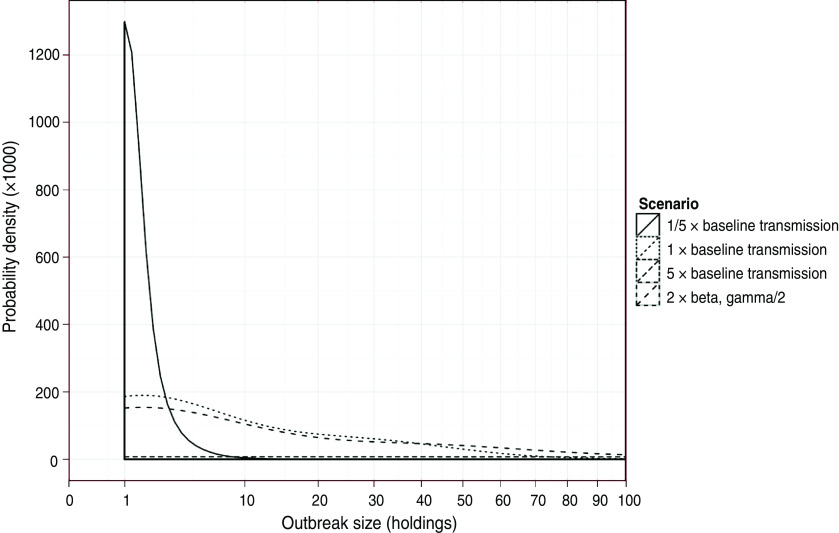
Fig. 3.
Distribution of simulated outbreak size up to 100 holdings of a simulated LPNAI outbreak seeded in a commercial duck holding in GB, and how it varies when the relative rate of transmission is increased and decreased by fivefold from a baseline level (the proportion of outbreaks of size >100 infected premises is provided in the text).

