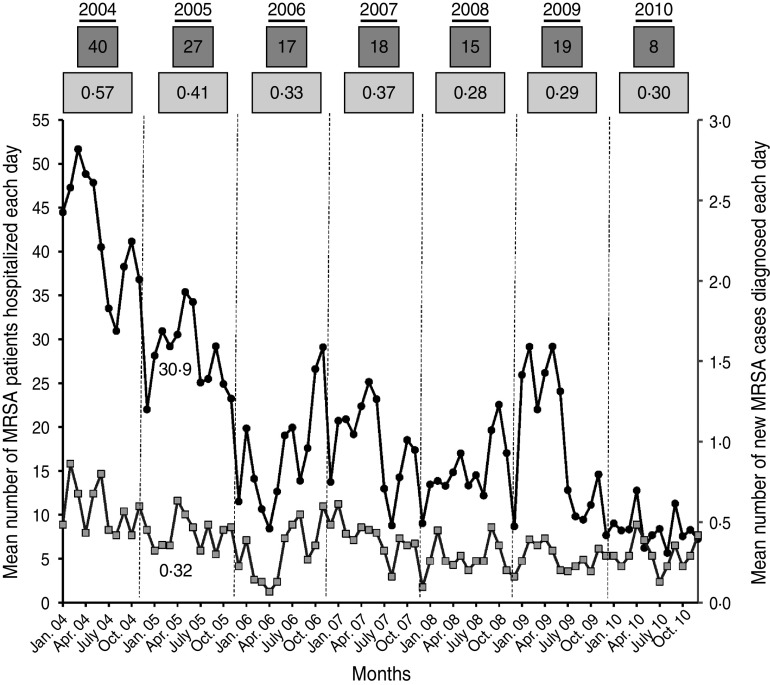
Fig. 2.
Assessment of MRSA colonization pressure in hospital. •, Each point corresponds to the mean monthly number of MRSA patients (new MRSA cases and readmitted MRSA patients) present in hospital each day. Numbers in dark grey boxes above the curves correspond to the annual average.  , Each point corresponds to the mean monthly number of new MRSA patients discovered each day. Numbers in light grey boxes above the curves correspond to the annual average.

