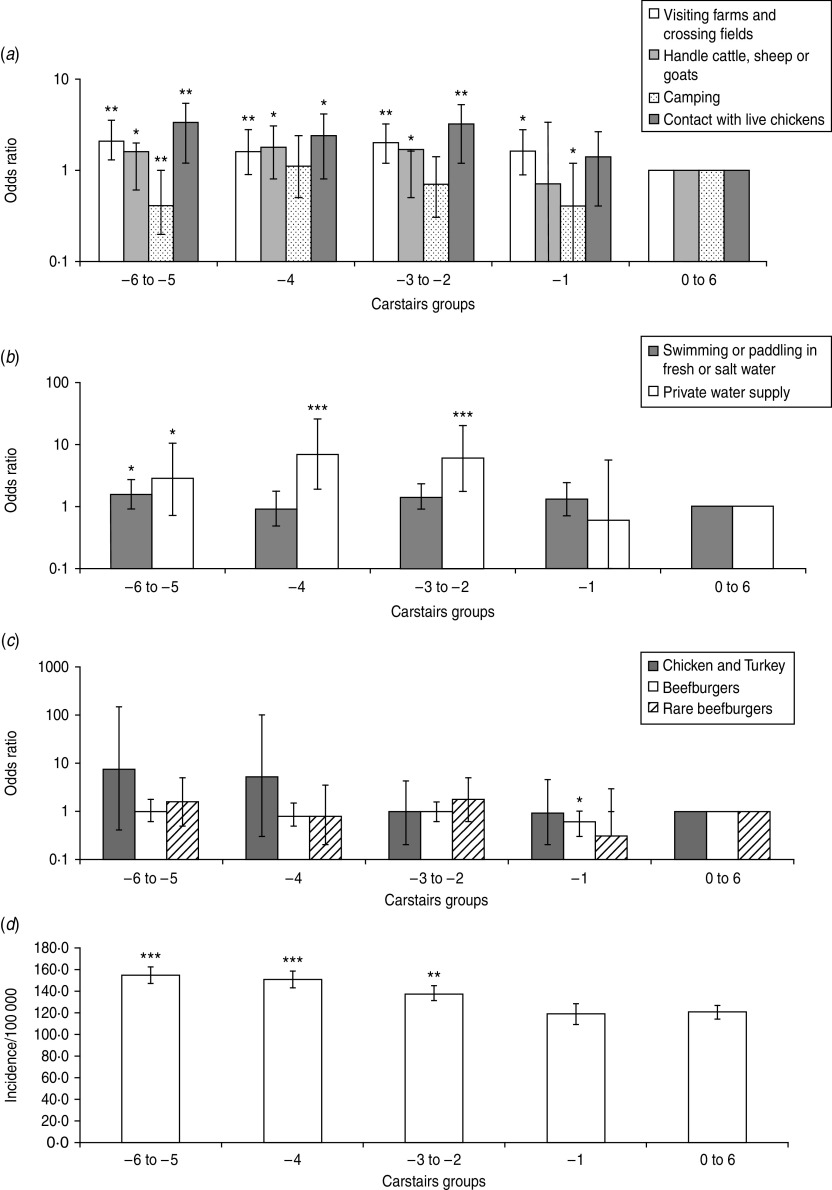
Fig. 3.
The odds ratio scores for Carstairs index exposure to source risk factors: (a) environmental exposure, (b) water exposure, (c) food exposure, and (d) the incidence of Campylobacter in Grampian. Significant difference between affluent and deprived areas is determined by comparison to the reference Carstairs group which is 0–6 (a–c). Significance is denoted by *P=0·05–0·01, **P=0·01–0·001 and ***P<0·001 for all graphs.

