FIGURE 3.
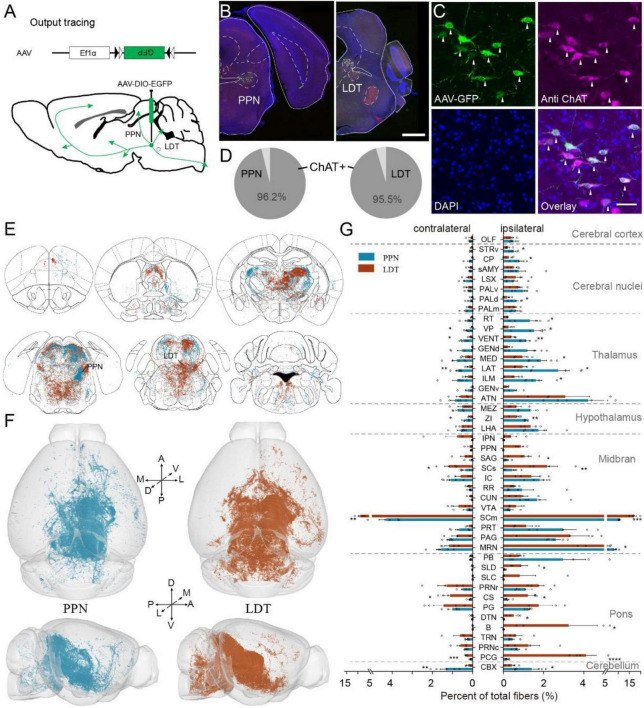
Whole brain projection of PMT cholinergic neurons. (A) The methods and processes for output tracing. (B) A typical coronal plane of an inject site; labeled cholinergic neurons are limited in object regions. (C) Immunofluorescent staining of cholinergic neurons; arrows point out ChAT-positive neurons. (D) The proportion of ChAT-positive neurons, PPN, 3 mice; LDT, 3 mice. (E) The whole-brain projection of PMT cholinergic neurons. (F) The 3D view of cholinergic projections in the whole brain. Left figures display the whole-brain projection of the PPN; right represents LDT. (G) Quantitative statistical proportion of main targeting regions from PPN and LDT. The left side of vertical axis represents proportion of cholinergic fibers in the contralateral hemispheres, while the right side represents ipsilateral hemispheres. A scale bar, (B) 1,000 μm; (C) 50 μm. The abbreviations of brain regions are provided in Supplementary Table 1. Data are shown as mean ± SEM. Two-sided t-tests, *p < 0.05, **p < 0.01, ***p < 0.001, ****p < 0.0001; PPN, 5 mice; LDT, 4 mice. For detailed P values, see Supplementary Table 2.

