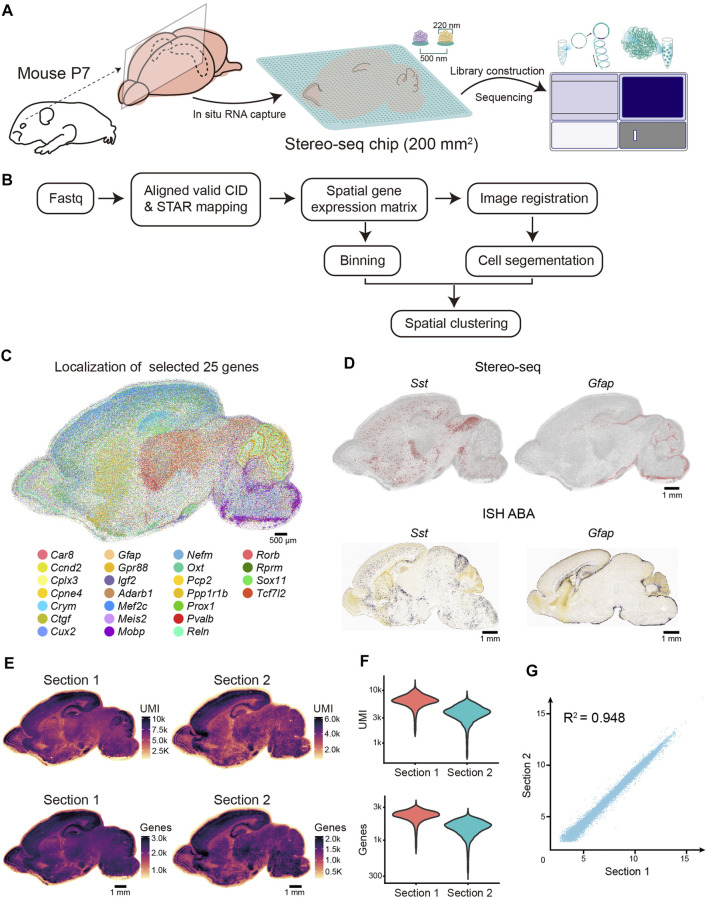
FIGURE 1.
Overview of the experimental method, data analysis workflow, and Stereo-seq data quality. (A) Schematic representation of the Stereo-seq workflow. Left, sagittal sections near the middle line were collected for the Stereo-seq profiling. Middle, in situ RNA capture from tissue. The effective area of chip in this study is 200 mm2. Spot size and center-to-center distance of Stereo-seq chip are 200 nm and 500 nm respectively. Right, library construction and sequencing. (B) Graphic representation of Stereo-seq analytical workflow. (C) Molecular localization of the 25 selected genes. Each dot represents a captured gene. Scale bar, 500 µm. (D) Top: Spatial visualization of Sst and Gfap localization of the P7 mouse brain section. Bottom: ISH images of Sst and Gfap localization of the P4 mouse brain section taken from ABA. Scale bars, 1 mm. (E) Spatial distribution of UMIs and genes (bin 50) per section. Scale bars, 1 mm. (F) Violin plot indicating the distribution of the UMI and genes (bin 50) per section. (G) Pearson correlation coefficient (R 2 = 0.948) between the two replicates.

