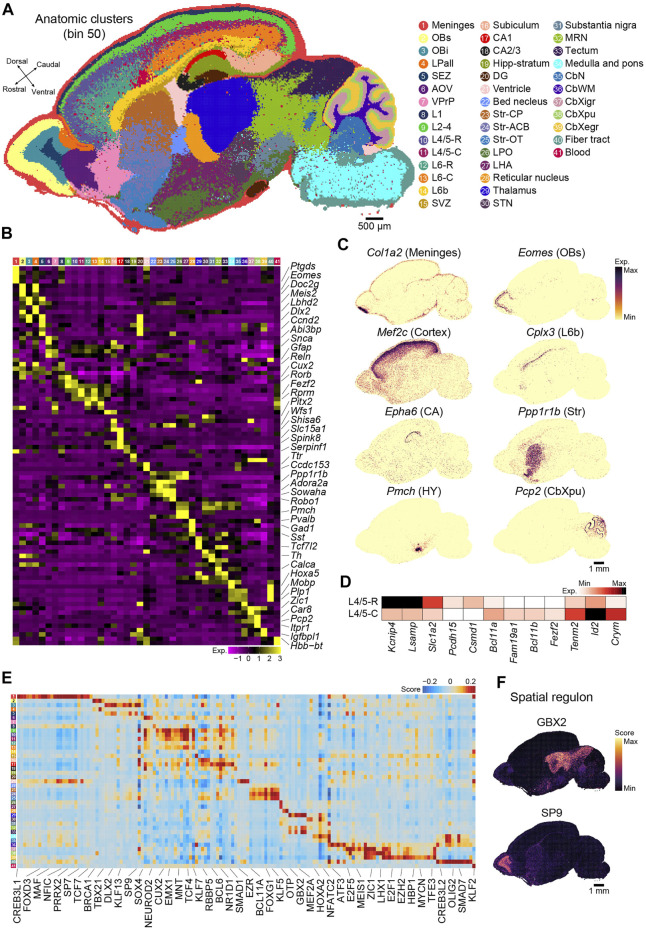
FIGURE 2.
Recognition of regional and molecular characteristics of the anatomical regions based on binning. (A) Unsupervised spatially constrained clustering of the P7 mouse brain sagittal section 1 analyzed by Stereo-seq at bin 50 resolution. Bins are colored by their annotation. OBs, superficial stratum of olfactory bulb; OBi, intermediate stratum of olfactory bulb; LPall, lateral pallium; SEZ, subependymal zone; AOV, anterior olfactory nucleus; VPrP, ventropallial prepiriform area; L1, cortical layer 1; L2–4, cortical layers 2–4; L4/5-R, cortical rostral layer 4/5; L4/5-C, cortical caudal layer 4/5; L6-R, cortical rostral layer 6; L6-C, cortical caudal layer 6; L6b, cortex layer 6b; SVZ, subventricular zone; CA1, cornu ammonis area 1; CA2/3, cornu ammonis area 2/3; Hipp-stratum, stratum molecular of CA and DG; DG, dentate gyrus; Str-CP, caudoputamen; Str-ACB, nucleus accumbens; Str-OT, olfactory tubercle; LPO, lateral preoptic area; LHA, lateral hypothalamus; STN, subthalamic nucleus; MRN, midbrain reticular nucleus; CbN, cerebellar nuclei; CbWM, white matter of the cerebellum; CbXigr, internal granular layer of the cerebellum cortex; CbXpu, Purkinje cell layer of cerebellum cortex; CbXegr, external granular layer of cerebellum cortex. Scale bar, 500 µm. (B) Heatmap of normalized expression of selected marker genes for the indicated 41 clusters of the P7 mouse brain shown in (A). (C) Spatial visualization of the indicated gene expression for meninges (Col1a2+), OBs (Eomes+), cortex (Mef2c+), L6b (Cplx3+), CA (Epha6+), Str (Ppp1r1b+), HY (Pmch+), and CbXpu (Pcp2+) in the section shown in (A). Scale bar, 1 mm. (D) Heatmap of the differential expressed genes between L4/5-R and L4/5-C. (E) Heatmap of each cluster’s predicted regulons for the P7 mouse brain section shown in (A). (F) Spatial visualization of the representative regulons in (E). Scale bar, 1 mm.

