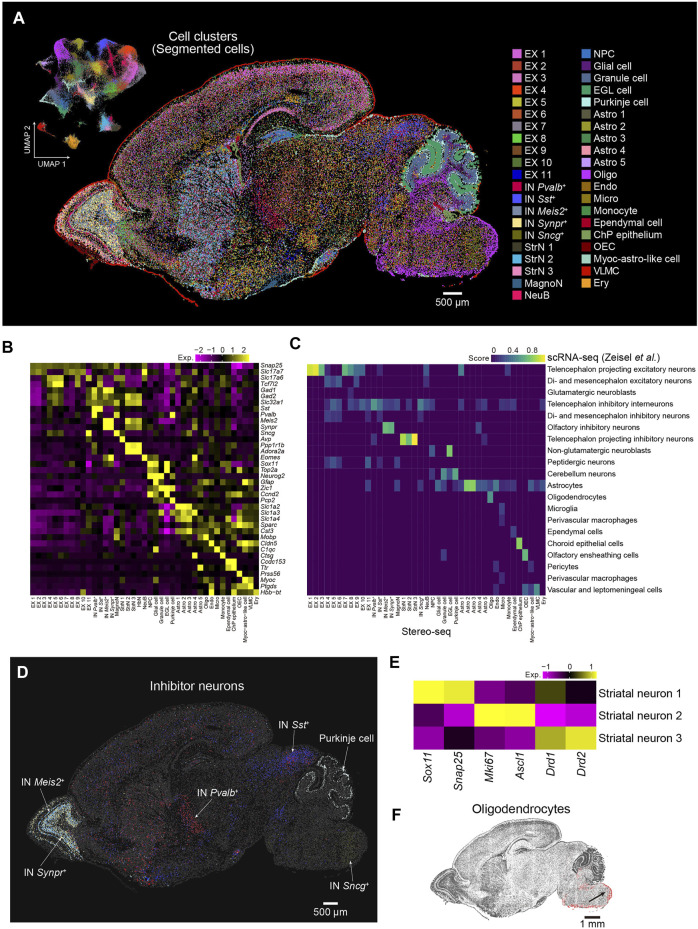
FIGURE 3.
Spatial distribution of cell types in the P7 mouse brain. (A) Left: UMAP visualization of the segmented cells from the P7 mouse brain section 1. Right: Spatial visualization of cell types shown in the left panel for the whole brain section 1. Cells are colored by the annotations. EX, excitatory neuron; IN, inhibitory neuron; MagnoN, magnocellular neuron; StrN, striatal neuron; NeuB, neuroblast; NPC, neuron progenitor cell; EGL cell, external granular layer cell; Astro, astrocyte; Oligo, oligodendrocyte; Endo, endothelium; Micro, microglia; ChP epithelium, choroid plexus epithelium; OEC, olfactory ensheathing cell; Myoc-astro-like cell, myoc-expressing astrocyte-like cell; VLMC, vascular leptomeningeal cell; Ery, erythrocyte. Scale bar, 500 µm. (B) Heatmap of normalized expression of selected marker genes for the 41 cell types of the P7 mouse brain shown in (A). (C) Correspondence between the cell types shown in A by Stereo-seq and the cell clusters identified by reported scRNA-seq (Zeisel et al., 2018). (D) Spatial visualization of different subtypes of inhibitor neuron clusters shown in (A). Scale bar, 500 µm. (E) Heatmap of normalized expression of the indicated genes for the three striatal neuron types shown in (A). (F) Spatial visualization of oligodendrocytes shown in (A). Scale bar, 1 mm.

