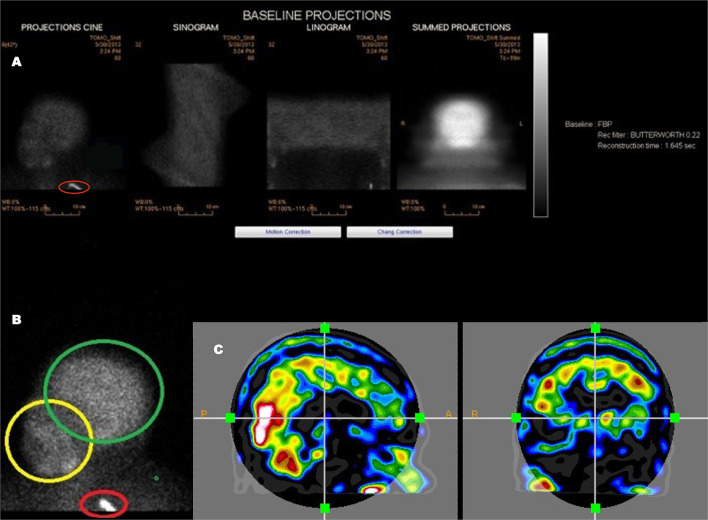
Figure 3.
An example of a poorly executed perfusion SPECT scan. (A) Projection cine, sinogram, linogram, and summed projections illustrate minimal motion artifact. However, multiple technical errors are evident. The detectors were positioned excessively far from the patient and the acquisition zoom was not correctly set which resulted in large areas of empty space above the head and inclusion down to at least the clavicle in the field of view. In addition, a spill artifact is seen at the level of the clavicle (red circle). The area occupied by the organ of interest—the brain—makes up a small part of the acquisition matrix, best demonstrated in the summed projections. (B) A close-up view of the projection cine illustrated relatively high uptake in the facial region (yellow circle) relative to the uptake in the brain (green circle) and the spill artifact (red circle) contributing significant number of counts which are unrelated to the brain. (C) Sagittal and coronal alignment images illustrating considerable uptake in the salivary glands and free technetium in the scalp. All of these extraneous counts will reduce the statistics available from the brain. Furthermore, the low spatial resolution of this poorly executed scan is clearly evident.

