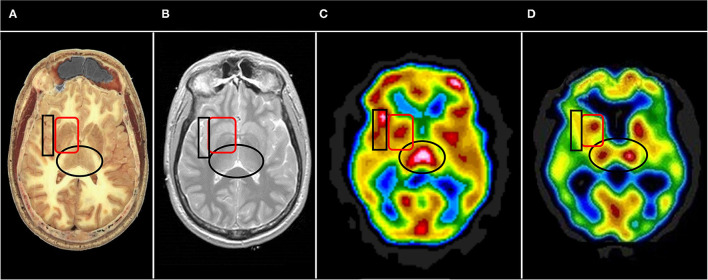
Figure 6.
Representative horizontal sections at the level of the thalamus and basal ganglia from (A) human cadaver, (B) MRI, (C) SPECT of healthy individual, and (D) SPECT of individual with advanced Alzheimer's disease. The thalami are indicated by the black oval in each frame. In healthy individuals the thalami are closely approximated with a narrow 3rd ventricle separating each side. Note the separation of the thalami in (D), consistent with volume loss due to degenerative changes. The basal ganglia are indicated by the red rounded square. The insula is indicated by the black box. Note the close approximation of the insular cortex to the lateral aspect of the basal ganglia separated only by the thin external capsule.

