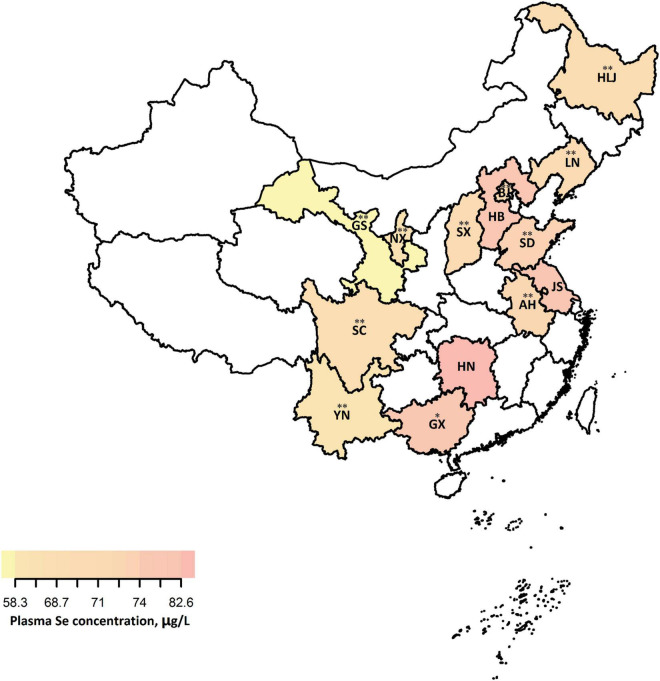
FIGURE 1.
Regional distribution patterns of plasma Se concentrations (μg/L) in Chinese middle-aged and elderly adults with hypertension1. 1Plasma Se concentrations were adjusted for sex, age, BMI, SBP, DBP, history of hypertension, antihypertensive drug use, multivitamin use, smoking, alcohol drinking, meat consumption, and consumption of fruits and vegetables. *p < 0.05, **p < 0.001, the average plasma Se concentration of this province significantly differed from that of the province with the relatively highest plasma Se status (Hunan, 88.6 μg/L). The 14 provinces in our study including AH, Anhui (n = 127); BJ, Beijing (n = 197); GC, Gansu (n = 185); GX, Guangxi (n = 200); HB, Hebei (n = 200); HLJ, Heilongjiang (n = 179); HN, Hunan (n = 200); JS, Jiangsu (n = 200); LN, Liaoning (n = 200); NX, Ningxia (n = 182); SC, Sichuan (n = 200); SD, Shandong (n = 172); SX, Shanxi (n = 196); and YN, Yunnan (n = 161).

