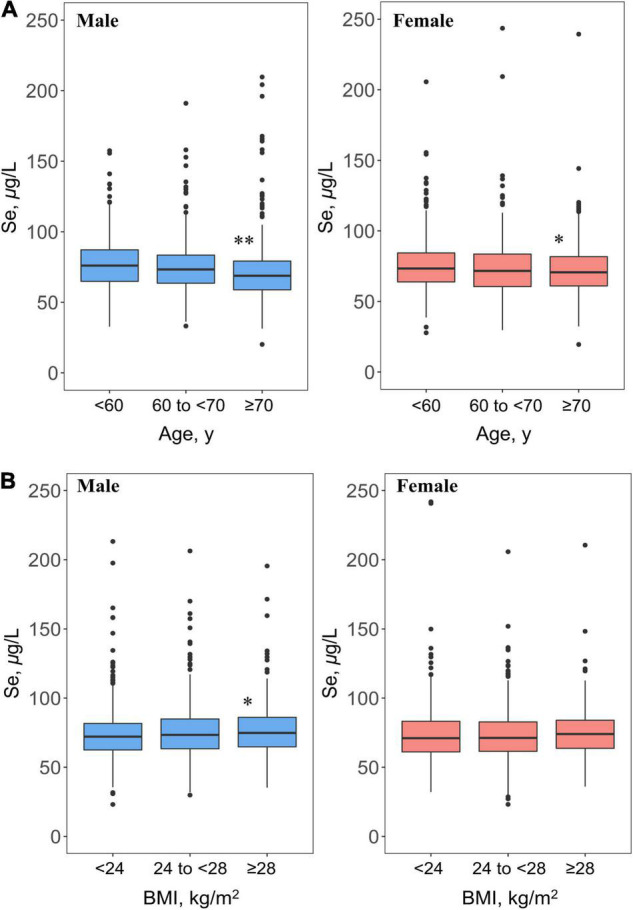
FIGURE 2.

Age (A) and BMI (B) distribution patterns of plasma Se concentrations (μg/L) in Chinese middle-aged and elderly adults with hypertension1. 1If not stratified, plasma Se concentrations were adjusted for sex, age, region (Se-marginal, Se-sufficient, and Se-rich areas), BMI, SBP, DBP, history of hypertension, antihypertensive drug use, multivitamin use, smoking, alcohol drinking, meat consumption, and consumption of fruits and vegetables. *p < 0.05, **p < 0.001, the average plasma Se concentration of this group significantly differed from those aged less than 60 years or with BMI less than 24 kg/m2 among male and female participants.
