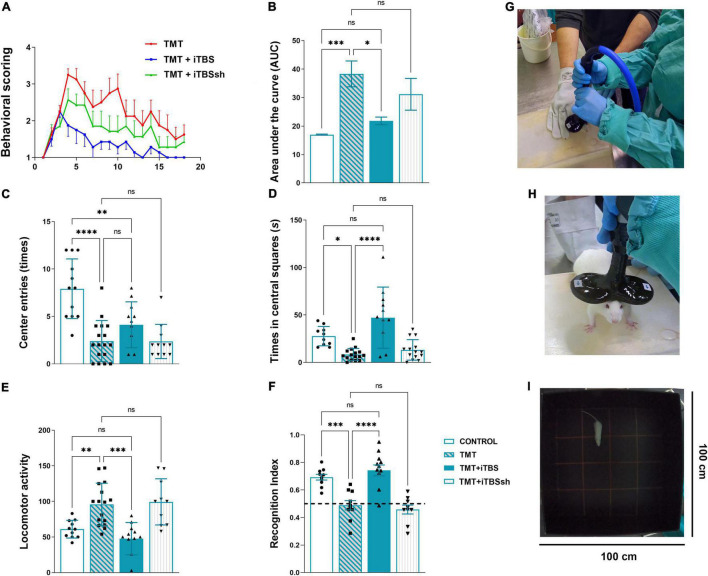
FIGURE 2.
Effect of iTBS treatment on behavior of TMT rats. (A) Graphic and (B) quantitative analysis of behavioral animal scoring. Bars represent the mean AUC ± SD. (C,D) Anxiety-like behavior and (E) motor activity, assessed in the open-field test. Bars represent (C) a mean number of entries, (D) a mean duration spent in central squares (s), and (E) a mean total movements, ±SD. (F) Recognition index determined by the novel object recognition test. Bars represent mean recognition index ± SD. Interrupted line represents 50% of recognition index, where animals showed no discrimination between novel and familiar object. Results of post hoc Tukey’s test and significance shown inside graphs, *p < 0.05, **p < 0.01, ***p < 0.001, ****p < 0.0001, ns, no significance. (G,H) iTBS coil placement. (I) The behavioral testing arena. Dots in the graphs represent values of individual animals.

