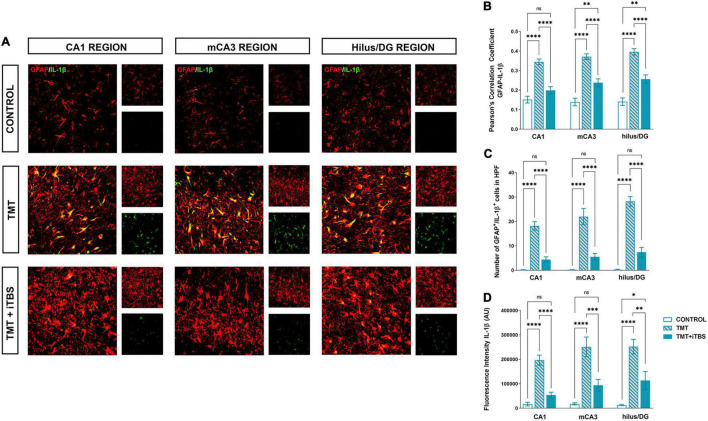
FIGURE 4.
Effect of iTBS treatment on TMT-induced astrocytic inflammation. (A) Double immunofluorescence staining directed to GFAP (red) and IL-1β (green) of coronal hippocampal sections captured in the same region levels. Scale bar = 50 μm. Integration of immunofluorescence intensity and quantitative analyses showing (B) Pearson’s correlation coefficient (PCC), (C) number of GFAP+/IL-1β+ cells in high power field (HPF), and (D) fluorescence intensity of IL-1β in arbitrary units (AU). Bars represent the mean value ± SEM of specific parameters calculated from acquired images (10–16/animal). Results of post hoc Tukey’s test and significance shown inside graphs: *p < 0.05, **p < 0.01, ***p < 0.001, ****p < 0.0001, ns, no significance.

