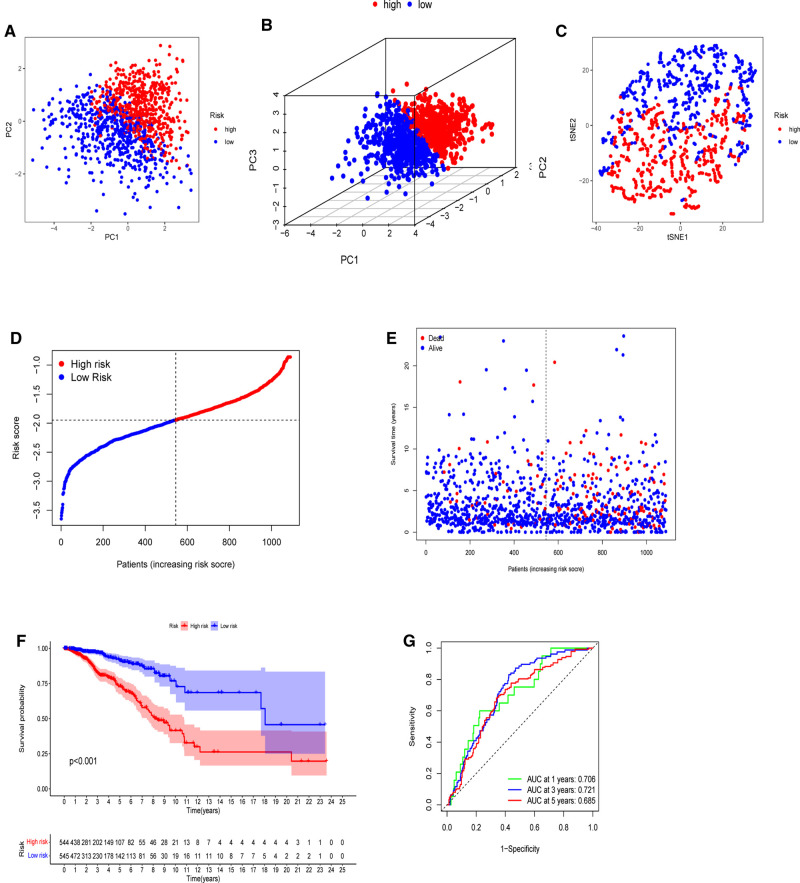
Figure 5.
Establishment of a five-gene predictive signature in the TCGA-BRCA cohort. (A) Two-dimensional principal component analysis (2D PCA) plot. (B) Three-dimensional principal component analysis (3D PCA) plot. (C) t-distributed stochastic neighbor embedding (t-SNE) analysis. (D) Distribution of calculated risk scores. (E) Survival status of BC patients. (F) Kaplan–Meier curves of high- and low-risk subgroups. (G) Time-dependent receiver operating characteristic (ROC) analysis.

