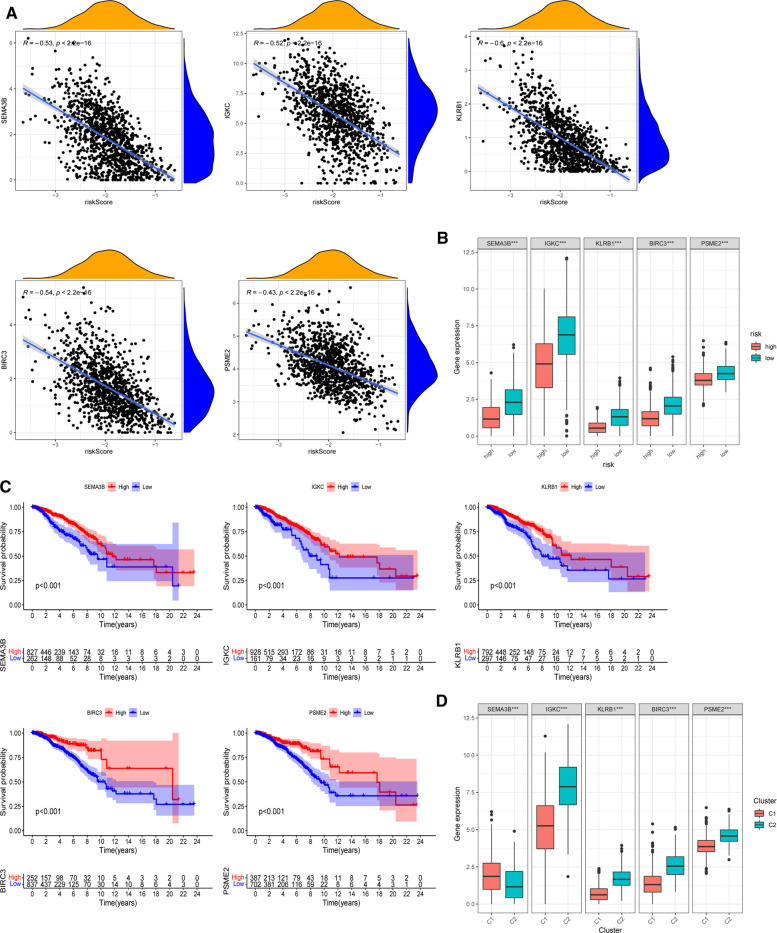
Figure 8.
Roles of selected five genes in risk signature and BC prognosis. (A) Correlations between risk signature and SEMA3B, IGKC, KLRB1, BIRC3, and PSME2. (B) Expression of the five genes in two risk subgroups. (C) Kaplan–Meier curves of SEMA3B, IGKC, KLRB1, BIRC3, and PSME2 in the TCGA-BRCA cohort. (D) Expression levels of the selected five genes in two PR clusters. *p < 0.05, **p < 0.01, ***p < 0.001, ns, not significant.

