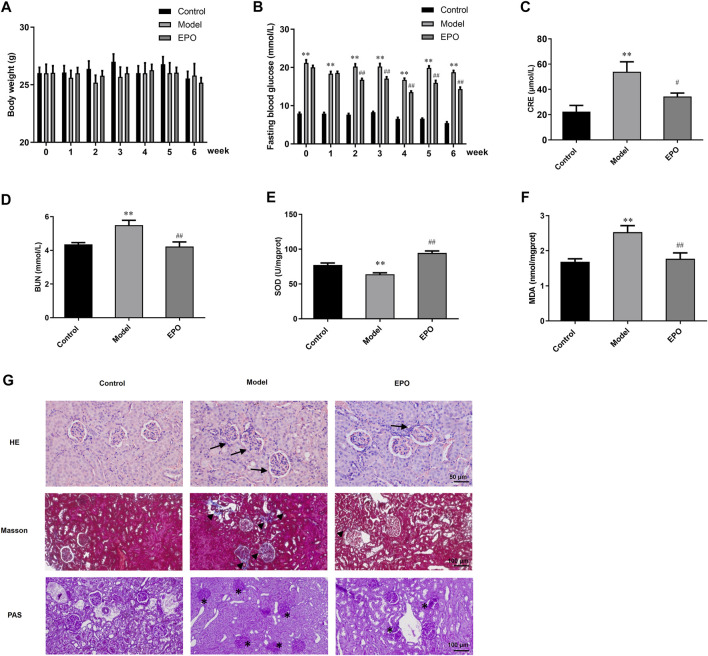
FIGURE 5.
EPO protected renal functions and morphological characteristics of DN mice. (A) The changes of body weight, (B) FBG levels, (C) serum creatinine, (D) blood urea nitrogen, (E) SOD activity, MDA, and (G) histological staining of kidney tissues in terms of HE, Masson and PAS staining. Arrows indicate the abnormal glomerular structure, arrowheads indicated the fibrosis deposition and asterisks indicate the deposition of mesangial matrix. Values are presented as mean ± SEM, for (A,B), n = 8; for (C,D), n = 3; for (E,F), n = 5. **p < 0.01 vs. Control group; # p < 0.05, ## p < 0.01 vs. Model group.

