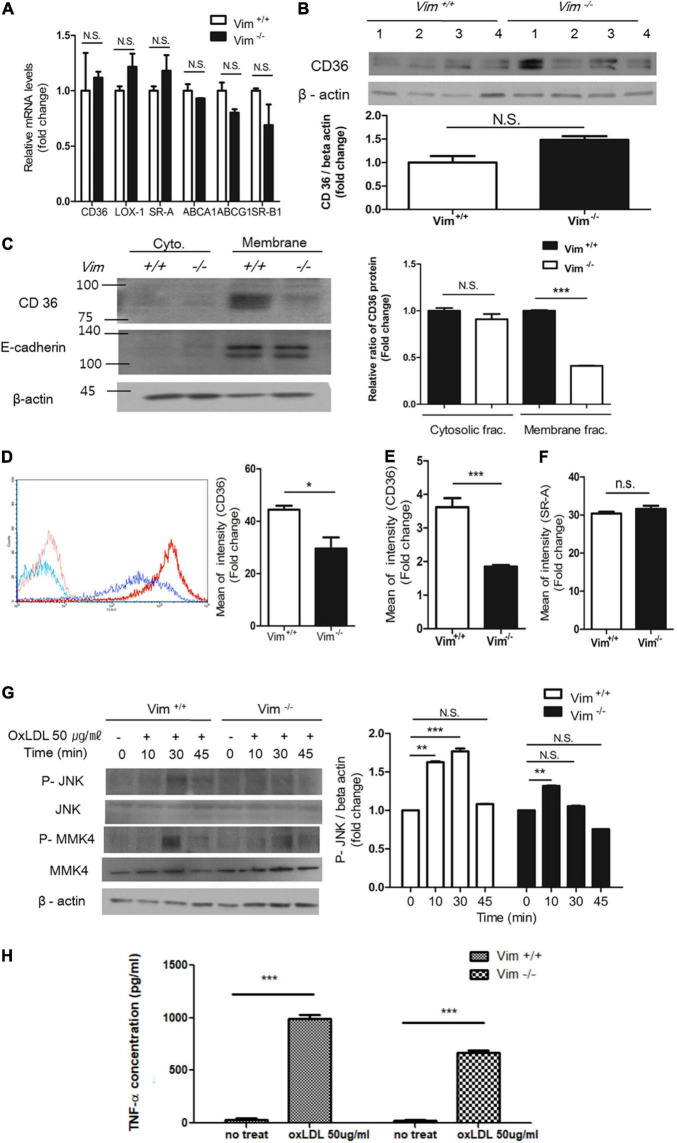
FIGURE 2.
Plasma membrane CD36 in Vim−/– macrophages was less than in Vim +/+ macrophages. (A) Quantitative real-time PCR was performed with RNAs from Vim +/+ and Vim−/– murine peritoneal macrophages. GAPDH was used as the internal control. (B) Western blot analysis for CD36 was performed using lysates of Vim +/+ (n = 4) and Vim−/– (n = 4) murine peritoneal macrophages. Each lysates were harvested from different mice. Beta actin was used as the internal control. (C) Western blot analysis for CD36 was performed using fractionated lysates of Vim +/+ and Vim−/– murine peritoneal macrophages. E-cadherin was used as the marker for plasma membrane fraction and GAPDH was used as the marker for cytosolic fraction. (D) Left, The representative flow cytometry data of Vim +/+ murine peritoneal macrophages and Vim−/– murine peritoneal macrophages with APC conjugated monoclonal antibody specific for CD36. Both cell types were incubated with either IgG control (Vim +/+: pink, Vim−/–: light blue) or with CD36 antibody (Vim +/+: red, Vim−/–: dark blue). Right, Comparison of fluorescence intensities representing cell surface-localized CD36 between Vim +/+ and Vim−/– murine peritoneal macrophages. (E) Flow cytometry. Comparison of fluorescence intensities representing cell surface-localized CD36 between Vim +/+ and Vim−/– murine bone marrow-derived macrophages (BMDM). (F) Flow cytometry. Comparison of fluorescence intensities representing cell surface-localized SR-A between Vim +/+ and Vim−/– murine peritoneal macrophages. (G) Western blot analysis for phospho-JNK, phospho-MMK4 and beta actin using lysates of Vim +/+ and Vim−/– murine peritoneal macrophages. Cells were incubated with oxLDL (50 μg/ml) for indicated times. Beta actin was used as the internal control. *p < 0.05, **p < 0.01, ***p < 0.001. The graph shows mean ± SEM for triplicated determinants of the experiments. (H) Vim+/+ and Vim−/– macrophages were treated with or without oxLDL (50 μg/ml) and TNF-α released by the macrophages in the media was measured by ELISA. ***p < 0.001.

