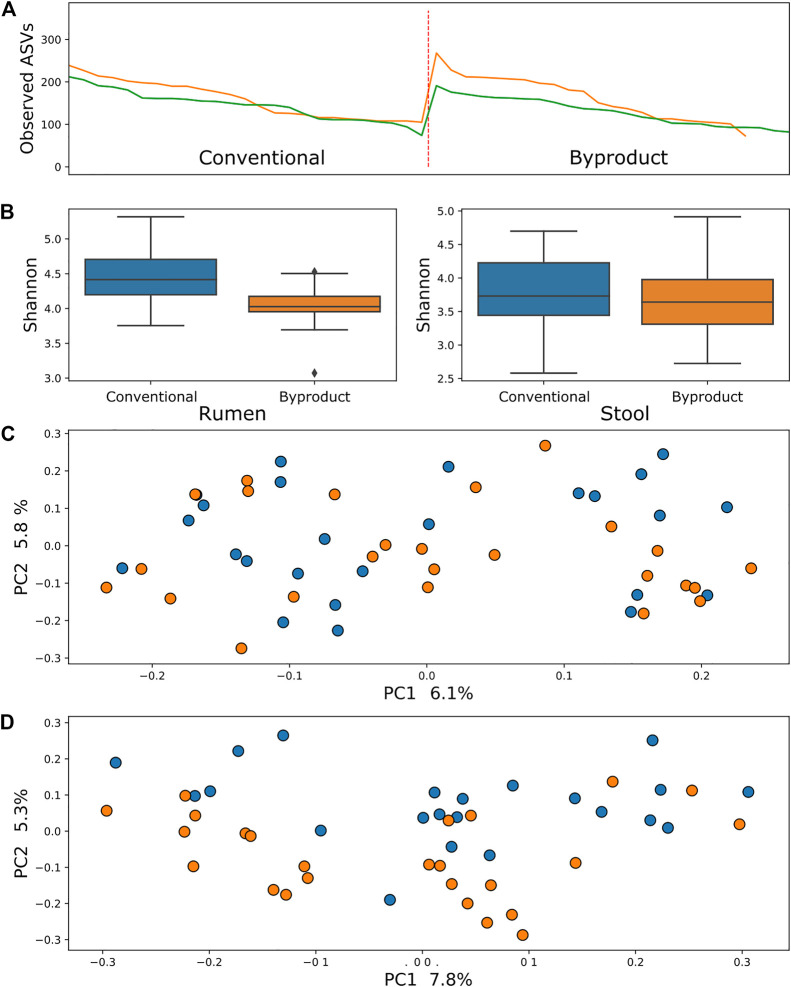
FIGURE 2.
(A) Comparison between observed ASV (amplicon sequence variants) metric between treatment groups showed no significant difference in archaea populations of animals submitted to different diets in both rumen (green line) and stool (yellow line). (B) Shannon index comparisons showing a significant difference (p < 0.01) in the richness of archaea in the rumen microbiome. (C) PCoA using the rumen microbiome unweighted UniFrac distance showing no significant difference between groups (p > 0.1). (D) PCoA using the stool microbiome unweighted UniFrac distance showing a tendency of clustering of samples from animals fed conventional diet (blue) and by-product diet (orange).

