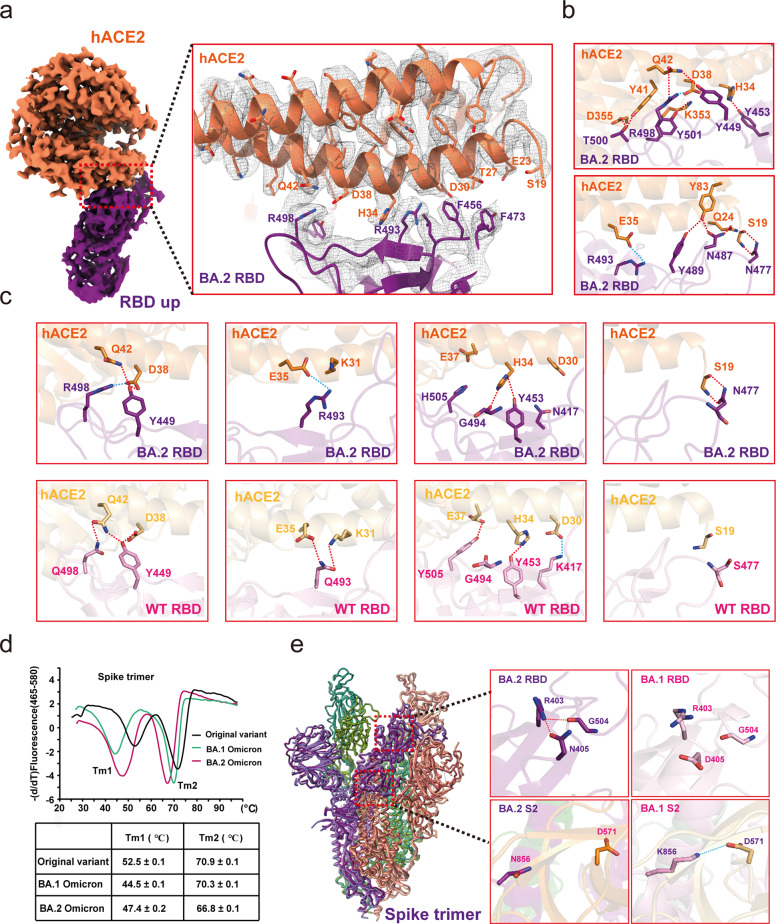
Fig. 2. Structural analysis of Omicron BA.2 RBD and hACE2.
a Cryo-EM density map of Omicron BA.2 RBD bound to hACE2. Residues are shown in sticks with the correspondent cryo-EM density represented in mesh. hACE2 is colored in coral. The Omicron BA.2 RBD is colored in purple. b Interactions between Omicron BA.2 RBD and hACE2. c Comparison of Omicron BA.2 RBD-hACE2 and WT RBD-hACE2 interfaces. Up panels, Omicron BA.2 RBD-hACE2 with hydrogen bonds and salt bridges interactions. Down panels, WT RBD-hACE2 with hydrogen bonds and salt bridges interactions. Interactions of hydrogen bonds and salt bridges are in dotted lines. d Thermal stability shift analysis of the Omicron BA.2, Omicron BA.1, and WT spike trimer. e The mutation-induced conformation changes of Omicron BA.2 RBD compared with BA.1 RBD.

