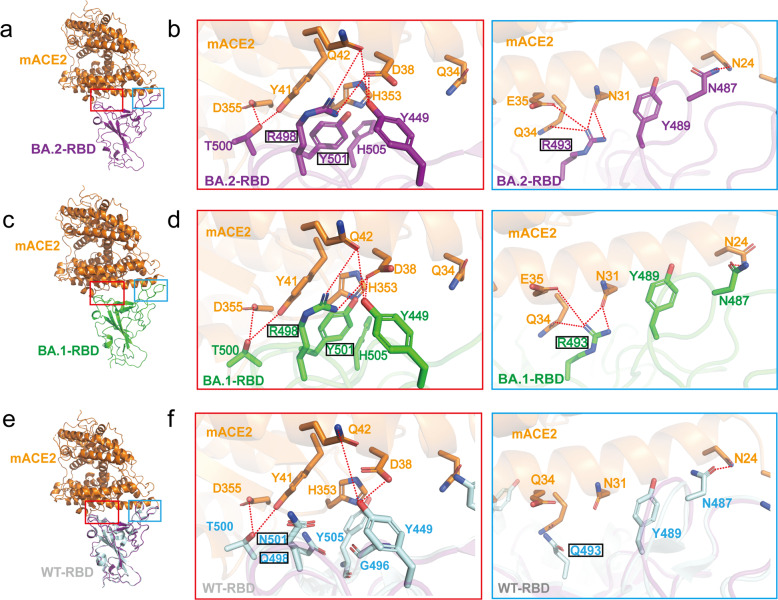
Fig. 6. Structural analysis of mACE2 and RBD.
a Overall structure of the BA.2-RBD and mACE2 complex. b Details of the binding between BA.2-RBD and mACE2. The binding between BA.2-RBM and mACE2 consists mainly of two interaction regions, marked in a red or a blue box. Residues involved in the interactions are shown as sticks. Hydrogen bonds are shown as dashed black lines. c, d Overall structure of the BA.1-RBD and mACE2 complex, with detailed hydrogen bond or salt bridge interactions in BA.1-RBD and ACE2 interface with the same view as in (a, b). e, f The superposition of the BA.2 RBD and mACE2 complex with SARS-CoV-2 WT-RBD alone (PDB: 6LZG). Detailed hydrogen bond or salt bridge interactions are highlighted with the same view as in a, b.

