Figure 1.
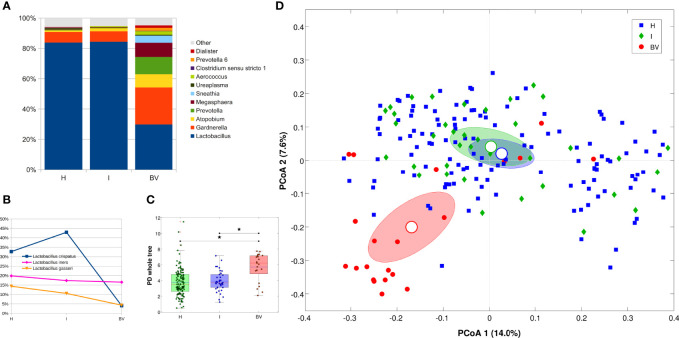
Microbiota characterization according to the vaginal status (H, I or BV). (A) Barplot of average relative abundances at genus level. Genera with rel. ab. ≤1% were grouped in “Others” category; (B) Line plot of average Lactobacillus species abundance per vaginal status; only the 3 most abundant species are represented; (C) Boxplot of Faith’s phylogenetic diversity of the samples (estimated at endpoint) for each vaginal status. Stars above the plots represent statistical significance (p<0.05); (D) Principal Coordinate Analysis (PCoA) based on unweighted Unifrac distance among samples. Each point represents a sample; ellipses are 95% SEM-based confidence intervals; point and ellipses are grouped according to vaginal status; the first and the second coordinate are represented.

