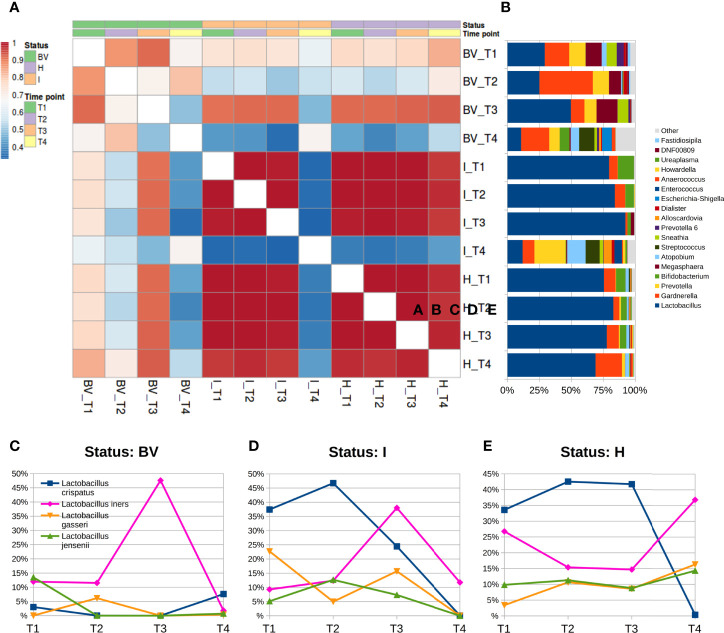
Figure 3.
Microbiota evolution during puerperium (T4). (A) Heatmap of Pearson’s correlation coefficients calculated between average relative abundances at genus level over time and stratified for vaginal status; (B) barplots of average relative abundances at genus level over time and stratified for vaginal status; genera with rel. ab. ≤1% were grouped in “Others” category; (C–E) Line plots of average abundances of Lactobacillus species over time. Only the four most abundant species are represented.

