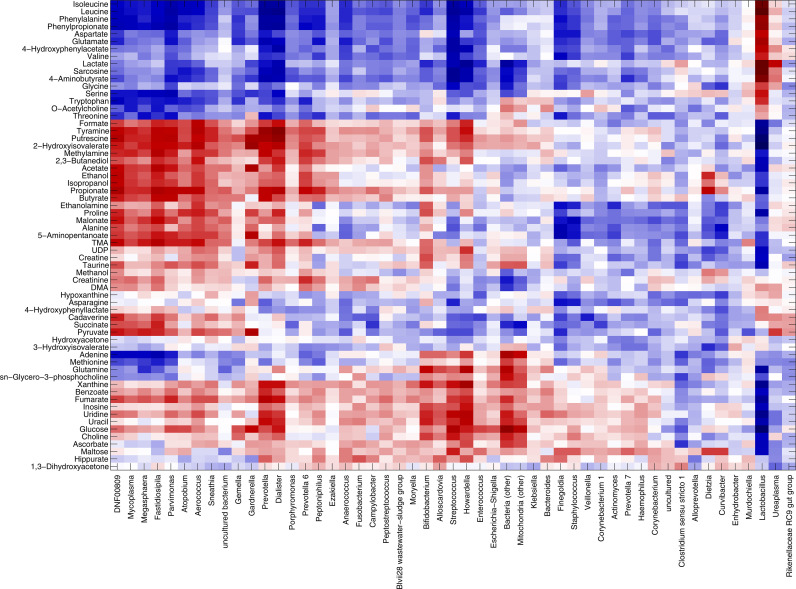
Figure 4.
Correlation between metabolome and microbiota. Heatmap showing the Spearman’s correlation coefficient between metabolites concentration and the relative abundances of the main bacterial genera over all samples collected, excluding miscarriages (n=219). Only groups present at >1% of relative abundance in at least one sample were considered. Metabolite and microbial data were clustered using Pearson’s correlation metric and average linkage.

