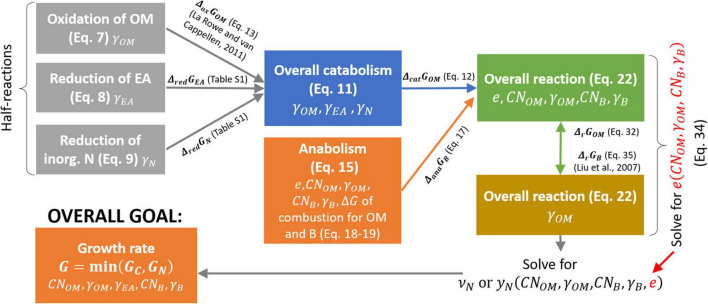
FIGURE 2.
Roadmap for the calculation of normalized microbial growth rate (G) as a function of OM and microbial C:N ratios (CNOM and CNB, respectively), and degrees of reduction of OM, EA, and biomass (γOM,γEA,and γB, respectively). Each box refers to a half or overall reaction (with equation number in brackets) and includes the parameters affecting the reaction stoichiometry (listed at the bottom of each box). Arrows represent the changes in Gibbs energy associated to each half reaction, which is then used to calculate the changes in Gibbs energy of the overall reactions. Symbols are defined in Table 1.

