FIGURE 3.

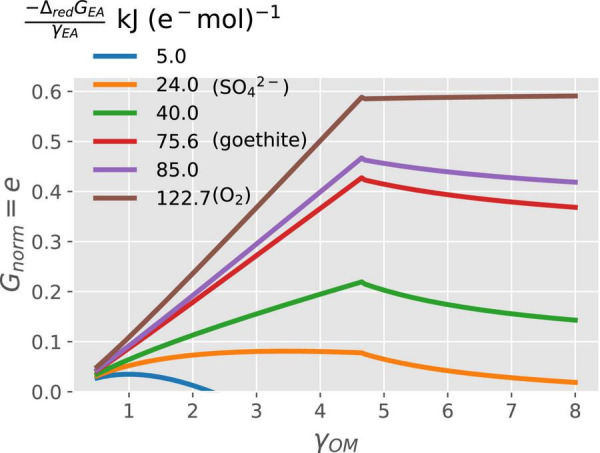
Variation of normalized growth rate (Gnorm) with the degree of reduction of the OM (γOM on the x-axis) and energy available from the reduction of EA (ΔredGEA; curves with different colors).

Variation of normalized growth rate (Gnorm) with the degree of reduction of the OM (γOM on the x-axis) and energy available from the reduction of EA (ΔredGEA; curves with different colors).