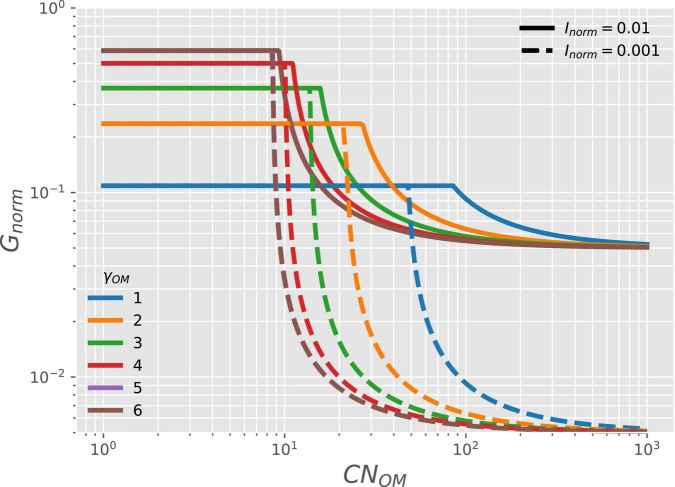
FIGURE 6.
OM containing N: variation of normalized microbial growth rate (Gnorm) along a gradient of OM C:N ratio [CNOM in C-mol (N-mol)–1] under oxic conditions, and with varying degree of reduction of the OM (γOM; curves with different colors) and two levels of NInorg-availability (Inorm, solid vs. dashed curves). For γOM > 5, curves are close to each other so that the curve for γOM = 5 is not visible and is below the brown curve.

