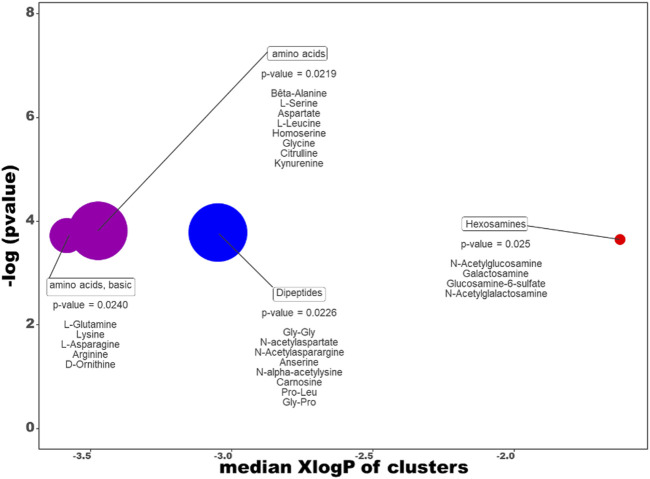
FIGURE 11.
ChemRICH diagram according to the dive effect. Each disc reflects a significantly altered family of metabolites. These groups are developed from chemical similarities highlighted by a hierarchical Tanimoto map (not shown) accessible in the ChemRICH program. Enrichment p-values are given by the Kolmogorov–Smirnov test. Disc sizes varies with the total number of metabolites. Blue or red discs present groups of underexpressed or overexpressed metabolites in Diver compared to Ctrl rats, respectively. Purple color represents both increased and decreased metabolites. For example, there are less dipeptides in the feces of the diver rats.

