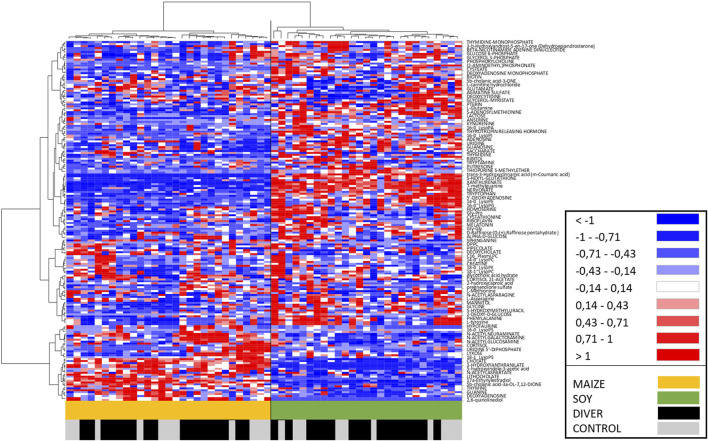
FIGURE 6.
Heat Map, i.e., hierarchical clustering of fecal metabolomes from Ctrl (grey) or Diver (black) rats. Rats are on the ordinate where green notes rats fed with soy and orange those fed with maize. Fold-change for each metabolite (abscissa) is represented by a color. Intensity values are normalized, from red (Min: −1) to blue (Max: +1).

