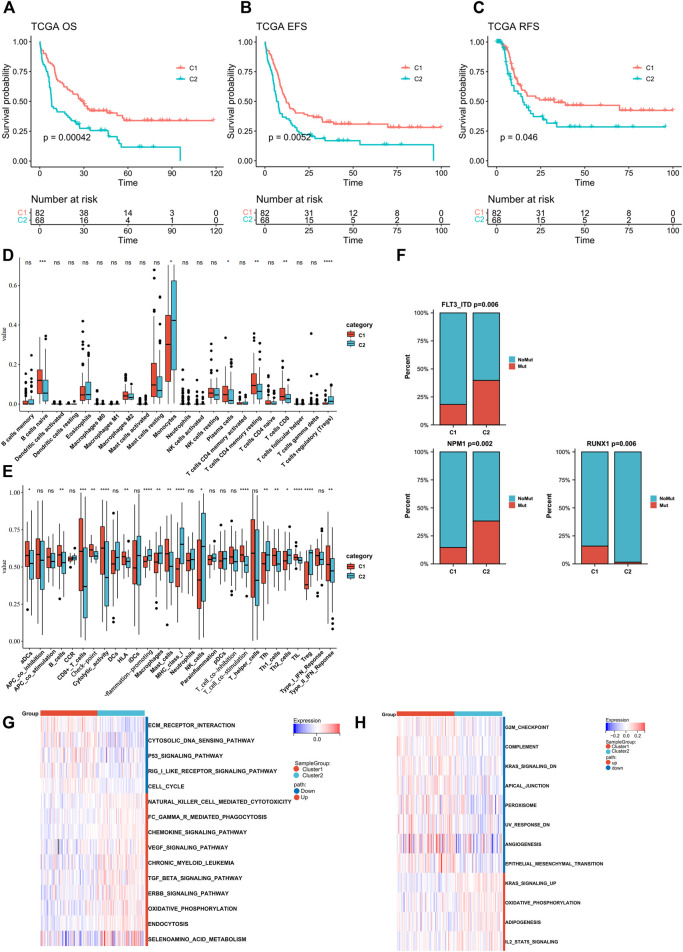
FIGURE 3.
Assessment of differences in prognosis, immune elements, and pathway enrichment between the two subtypes in TCGA cohort. (A–C) Kaplan–Meier survival analysis of the two clusters in TCGA (OS, overall survival; EFS, event-free survival; RFS, relapse-free survival. C1 n = 82, C2 n = 68; log-rank p-test). (D,E) Comparison of the difference in immune cell fraction and immune response between the two subtypes, with CibersortX and ssGSEA algorithm (Wilcoxon tests). (F) FLT3-ITD, NPM1, and RUNX1 mutation distribution between the two subtypes (Chi-Square tests). (G,H) Heatmaps of GSVA-based KEGG and Hallmark analysis of the two subtypes (Wilcoxon tests).

