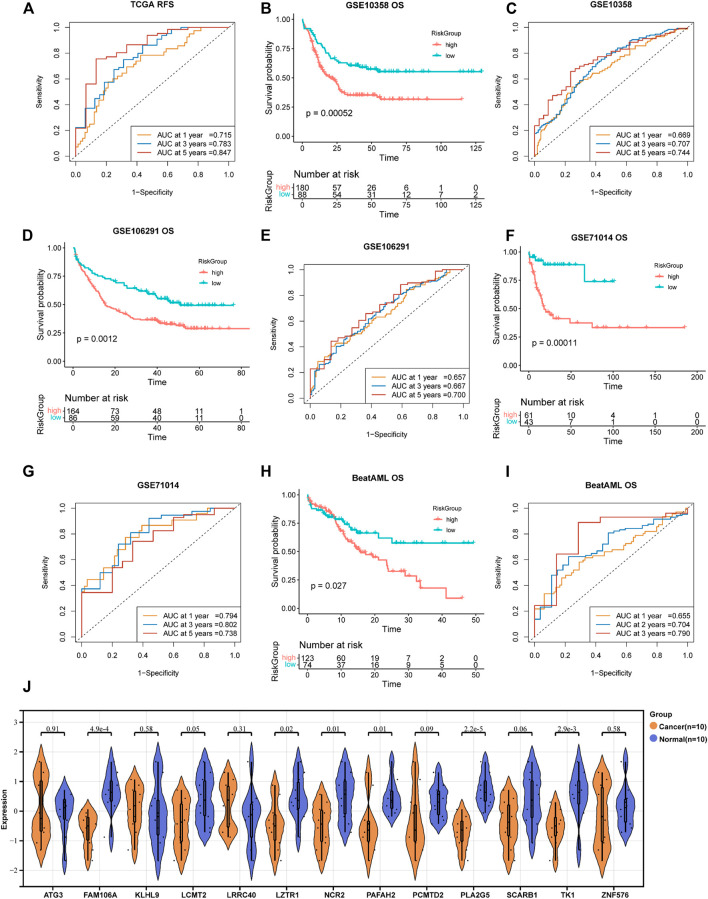
FIGURE 5.
Validation of the 13-gene prognostic signature in different datasets. (A,B) RFS analysis and ROC of the risk group in TCGA dataset. Reciprocal survival analysis and ROC of GSE71014 (C,D), GSE106291 (E,F), and BeatAML (G,H) datasets were illustrated. 5I ROC of GSE10358 survival analysis displayed in Figure 4K. (J) RT-PCR-detected RNA expression of 13 genes in our own samples, 10 AML de novo, and 10 IDA as normal control samples.

