FIGURE 6.
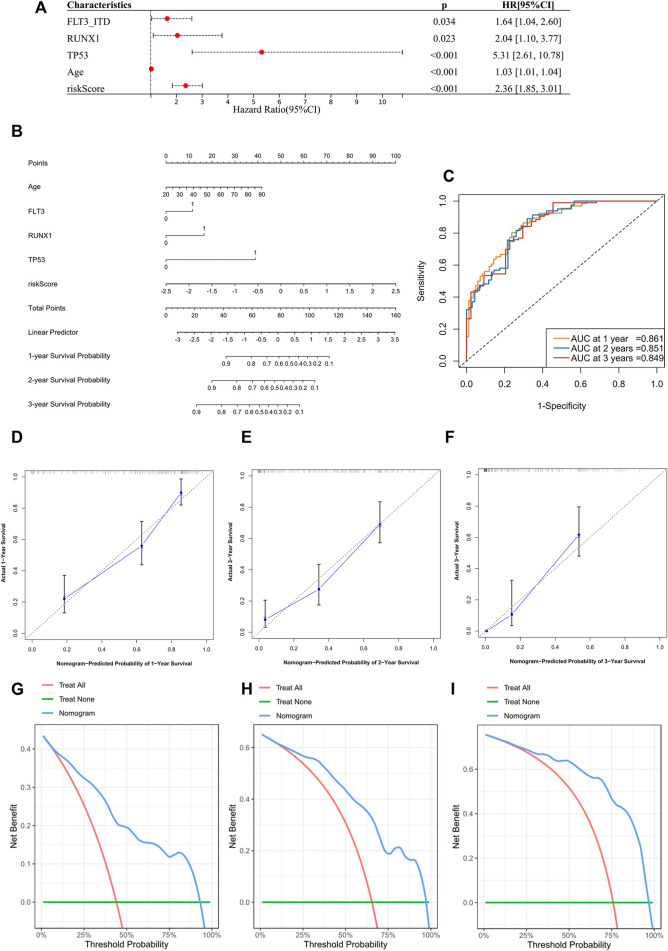
Construction of a prognostic nomogram in TCGA datasets. (A) Multivariate analysis to validate independent prognostic factors from the previous multivariate Cox screening in Supplementary Figure S4N. (B) Nomogram for clinical diagnosis based on age, mutation status, and risk score. (C) ROCs for the nomogram. (D–F) Calibration plots for predicting survival at 1, 2, and 3 years. The x-axis represents the predicted survival probability from the nomogram, and the y-axis represents the actual survival probability. (G–I) Decision curve analysis of the nomogram for 1-, 2-, and 3-year risk. The x-axis represents the threshold probability, and the y-axis represents the net benefit. The green line represents the assumption that no patients died at 1, 2, or 3 years. The red line represents the assumption that all patients died at 1, 2, or 3 years, and the blue line represents the prediction model of the nomogram.

