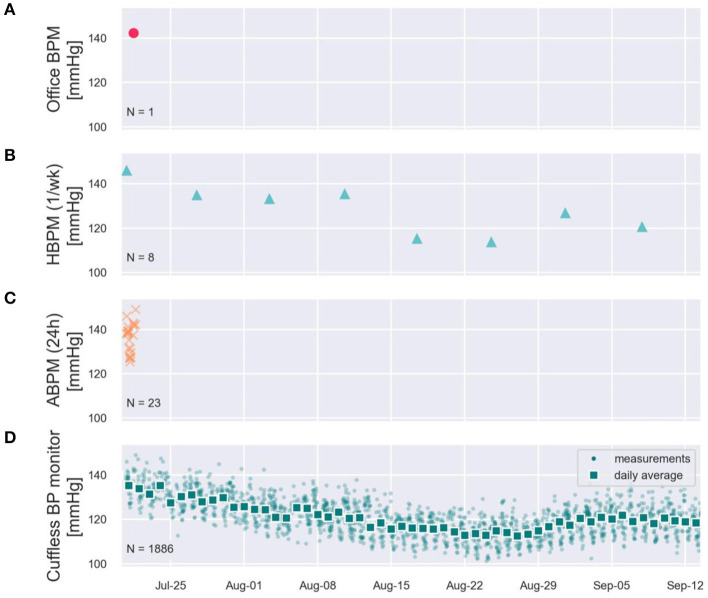
Figure 3.
Simulated office (A), Simulated HBPM once/week (B), simulated ABPM (C), and two months of measured continual cuffless BP data (D) on a single user, depicting typical day-night excursions of Systolic BP of 10 mmHg (night dip), and a superposed decreasing trend of BP across the summer weeks.

