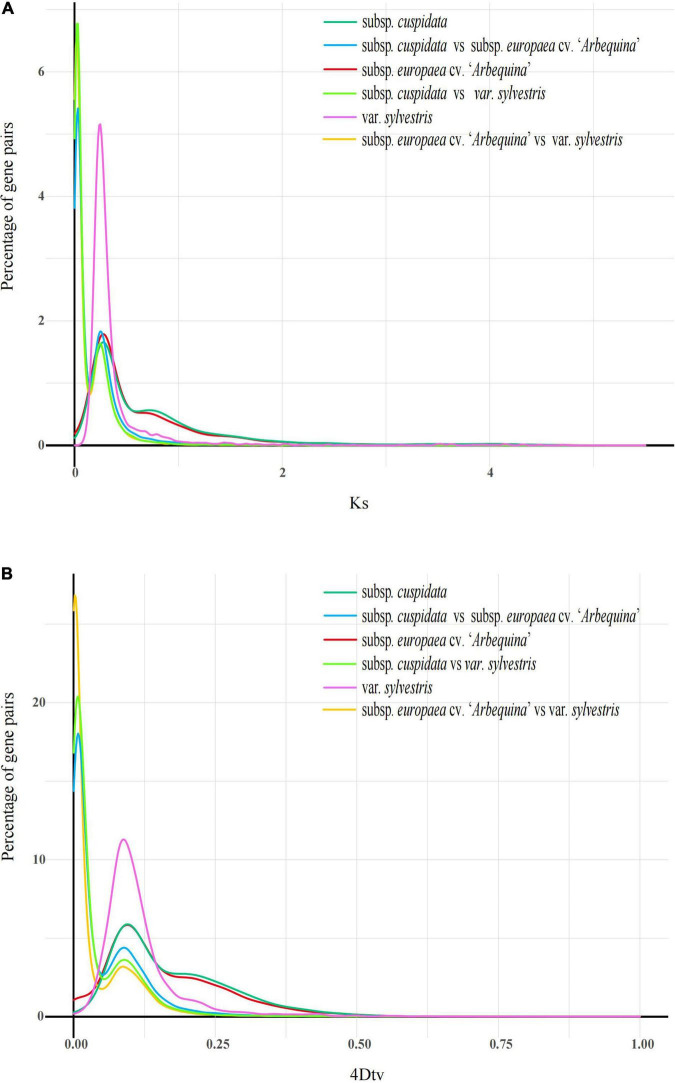
FIGURE 4.
Whole-genome duplication (WGD) analysis. (A) Ks distributions analysis. Peaks of intraspecies Ks distributions indicate whole genome polyploidization events, and peaks of interspecies Ks distributions indicate speciation events. (B) The 4DTv distribution of gene pairs in subsp. cuspidata and other genomes. The x-coordinate is the 4DTv value, and the y-coordinate represents the proportion of genes corresponding to the 4DTv values.

