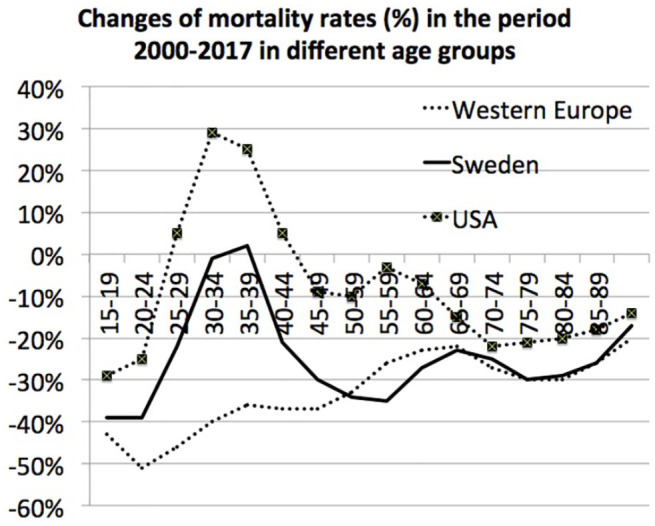
Figure 2.

Mortality rates in the year 2017 compared with mortality rates in the year 2000, in three different age groups, in Sweden, Western Europe and the USA. Changes are presented as the rate in 2017 as a percentage of the rate in 2000.

Mortality rates in the year 2017 compared with mortality rates in the year 2000, in three different age groups, in Sweden, Western Europe and the USA. Changes are presented as the rate in 2017 as a percentage of the rate in 2000.